PUBLISHER: Mordor Intelligence | PRODUCT CODE: 2122196

PUBLISHER: Mordor Intelligence | PRODUCT CODE: 2122196
Optical Transport Network - Market Share Analysis, Industry Trends & Statistics, Growth Forecasts (2026 - 2031)
According to Mordor Intelligence, the optical transport network market size is USD 29.39 billion in 2026 and is forecast to reach USD 44.03 billion by 2031, advancing at an 8.42% CAGR.
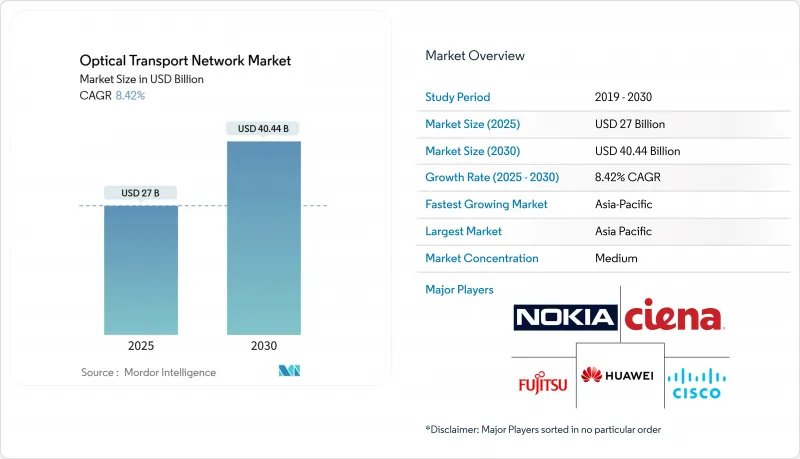
This report is Segmented by Technology (WDM, DWDM, and More), Offering (Services, and Components), End-User Vertical (IT and Telecom Operators, Healthcare, and More), Application (Data Center Interconnect, Metro Networks, Enterprise Networks, and More), Data Rate/Wavelength (100-400 Gbit/S, 400-800 Gbit/S, Beyond 800 Gbit/S), and Geography. The Market Forecasts are Provided in Terms of Value (USD).
Global Optical Transport Network Market Trends and Insights
Rapid 400 ZR/ZR+ Adoption for Data Center Interconnect
Microsoft's Azure network surpassed 50,000 deployed 400ZR modules in 2025, proving that coherent pluggables slash footprint by 40% and power by 30% compared with legacy DWDM shelves. Merchant-silicon suppliers now sell modules directly to hyperscalers, bypassing traditional optical vendors and reshaping procurement models. Ciena confirmed that pluggables accounted for 22% of WaveLogic revenue in fiscal 2025, up from 11% in the prior year. As hyperscalers standardize on 400ZR/400ZR+ for metro DCI links of 80-120 km, the optical transport network market gains a durable volume catalyst that offsets telco spending cyclicality.
Hyperscaler AI-Cluster Traffic Boom
Generative-AI training demands bandwidth dense enough to interconnect clusters of 25,000 GPUs at 400 Gbit/s, driving an unprecedented wave of DCI spending. Amazon Web Services, Microsoft Azure, Google Cloud, and Meta earmarked a combined USD 400 billion of 2026 capital outlays, roughly 35% of which targets networking infrastructure. Transceiver lead times have stretched to 52 weeks for 800 Gbit/s devices, advantaging vendors with captive photonics fabs. The shift toward IP-over-DWDM architectures allows routers with integrated coherent optics to bypass OTN switching, trimming costs but lowering service-layer revenues for carriers.
Capex Freeze at Tier-2 Telcos (2024-2025)
Deutsche Telekom trimmed German fixed-network investment 8% year over year, while America Movil reduced 2025 capex guidance in Brazil and Colombia by 12% in response to higher interest costs. Spending deferrals weigh on regional vendors such as ADVA, yet top suppliers partially hedge the shortfall with hyperscaler sales. Analysts expect a rebound once 5G backhaul needs and subsidy programs reignite upgrades after 2027.
Other drivers and restraints analyzed in the detailed report include:
- Government Fibre-Backhaul Stimulus
- Open-Line Systems Lowering Capex
- US-China Export Controls on Coherent DSPs
For complete list of drivers and restraints, kindly check the Table Of Contents.
Segment Analysis
DWDM systems held a 49.72% share of the optical transport network market in 2025, underscoring their dominance in long-haul and submarine corridors, where spectral efficiency dictates economics. Nokia's PSE-6s platform shows that coherent pluggables can now serve metro access links, merging DWDM performance with WDM simplicity. WDM solutions will post a 9.11% CAGR as metro operators adopt lower-cost 5G backhaul architectures. In turn, merchant-silicon vendors capture value from this convergence, reshaping competitive dynamics.
Legacy O-band technology remains niche for campus interconnects but illustrates application-specific segmentation. Ciena reported an 18% jump in WaveLogic revenue in fiscal 2025, while its traditional OTN switching revenue fell 3%, signaling internal value migration. As coherent pluggables mature, DWDM economics extend toward edge nodes, putting pressure on smaller suppliers that lack R&D heft. The optical transport network market, therefore, faces consolidation even as technology options broaden.
Components generated 58.44% of 2025 revenue, reflecting the large installed base of optical transport equipment. Yet services, projected to grow at an 8.89% CAGR, increasingly monetize the complexity of open-line systems. Cisco disclosed 68% gross margins for optical services, far above hardware margins, underscoring its strategic pivot toward recurring revenue.
The optical transport network market for services will expand as carriers outsource multi-vendor integration and capacity planning. Compact modular platforms such as Infinera's GX G42 fuse switching and transport, reducing footprint and driving demand for lifecycle support over pure hardware refreshes. AI-driven diagnostics could erode some maintenance revenue, but vendors offset this by layering traffic optimization analytics on top of support contracts.
Complete Report Scope:
- By Technology
- WDM
- DWDM
- O-Band and Other Technologies
- By Offering
- Services
- Network Maintenance and Support
- Network Design and Integration
- Components
- Optical Transport Equipment
- Optical Switch
- Optical Platform/Edge ROADM
- Services
- By End-User Vertical
- IT and Telecom Operators
- Cloud and Colocation Data Centres
- Government and Defence
- Healthcare
- Banking and Financial Services
- Other End-User Verticals
- By Application
- Long-Haul DWDM
- Data-Center-Interconnect
- Metro Networks
- Enterprise Networks
- By Data Rate / Wavelength
- 100-400 Gbit/s
- 400-800 Gbit/s
- Beyond 800 Gbit/s
- By Geography
- North America
- United States
- Canada
- Mexico
- Europe
- Germany
- United Kingdom
- France
- Russia
- Rest of Europe
- Asia-Pacific
- China
- Japan
- India
- South Korea
- Australia
- Rest of Asia-Pacific
- Middle East and Africa
- Middle East
- Saudi Arabia
- United Arab Emirates
- Rest of Middle East
- Africa
- South Africa
- Egypt
- Rest of Africa
- Middle East
- South America
- Brazil
- Argentina
- Rest of South America
- North America
Geography Analysis
Asia-Pacific held 35.67% of 2025 revenue, buoyed by China's backbone upgrades and India's BharatNet Phase III, which allocated INR 1.39 trillion (USD 16.8 billion) to rural fiber. China's three state carriers installed 180,000 new 100 Gbit/s wavelengths during 2024-2025. U.S. export controls, however, could slow China's transition to 800 Gbit/s gear, widening the technology gap with Western operators. Japan and South Korea continue to drive submarine innovation, with NEC securing a 24-fiber-pair Tokyo-Los Angeles cable supporting 400 Tbit/s.
The Middle East is projected to post the fastest CAGR of 9.47% through 2031. Saudi Arabia's Public Investment Fund committed USD 6.4 billion to twelve hyperscale data centers in 2025, each requiring 400 Gbit/s redundant links. UAE-based Khazna Data Centers is deploying 1.6 Tbit/s WaveLogic 6 optics on the Dubai-Abu Dhabi corridor, underlining sovereign efforts to localize AI training workloads.
North America and Europe remain the largest absolute markets thanks to legacy DWDM estates awaiting refresh. The BEAD program's USD 42.45 billion stimulus will drive metro DWDM and coherent-pluggable demand, while Europe's submarine projects, such as EllaLink and 2Africa, sustain long-haul orders. Capex freezes at some tier-2 European telcos temper near-term growth, yet cross-border CEF-2 funds of EUR 2.07 billion (USD 2.2 billion) should close connectivity gaps in Poland, Romania, and Greece. Regulatory oversight by the FCC and ETSI ensures interoperability, tempering vendor lock-in but potentially lengthening approval cycles.
- Nokia Corporation
- Ciena Corporation
- Cisco Systems, Inc.
- Huawei Technologies Co., Ltd.
- Fujitsu Limited
- ZTE Corporation
- Infinera Corporation
- Telefonaktiebolaget LM Ericsson
- NEC Corporation
- ADVA Optical Networking SE
- Ribbon Communications Inc.
- Tejas Networks Limited
- Juniper Networks, Inc.
- Sterlite Technologies Limited
- Padtec Holding S.A.
- FiberHome Telecommunication Technologies Co., Ltd.
- Lumentum Holdings Inc.
- Coherent Corp.
Additional Benefits:
- The market estimate (ME) sheet in Excel format
- 3 months of analyst support
TABLE OF CONTENTS
1 INTRODUCTION
- 1.1 Study Assumptions and Market Definition
- 1.2 Scope of the Study
2 RESEARCH METHODOLOGY
3 EXECUTIVE SUMMARY
4 MARKET LANDSCAPE
- 4.1 Market Overview
- 4.2 Market Drivers
- 4.2.1 Rapid 400 ZR/ZR+ Adoption for Data Center Interconnect
- 4.2.2 Hyperscaler AI-Cluster Traffic Boom
- 4.2.3 Government Fibre-Backhaul Stimulus (US BEAD, EU CEF-2)
- 4.2.4 Open-Line Systems Lowering Capex
- 4.2.5 Silicon Photonics Price Inflection
- 4.2.6 Under-Sea Green-Field Cables
- 4.3 Market Restraints
- 4.3.1 Capex Freeze at Tier-2 Telcos (2024-25)
- 4.3.2 US-China Export Controls on Coherent DSPs
- 4.3.3 Skilled-Labour Shortage for Fibre Installation
- 4.3.4 Supply-Chain Dependency on InP Epitaxy
- 4.4 Industry Value Chain Analysis
- 4.5 Regulatory Landscape
- 4.6 Technological Outlook
- 4.7 Impact of Macroeconomic Factors on the Market
- 4.8 Porter's Five Forces Analysis
- 4.8.1 Threat of New Entrants
- 4.8.2 Bargaining Power of Buyers
- 4.8.3 Bargaining Power of Suppliers
- 4.8.4 Threat of Substitutes
- 4.8.5 Intensity of Competitive Rivalry
5 MARKET SIZE AND GROWTH FORECASTS (VALUE)
- 5.1 By Technology
- 5.1.1 WDM
- 5.1.2 DWDM
- 5.1.3 O-Band and Other Technologies
- 5.2 By Offering
- 5.2.1 Services
- 5.2.1.1 Network Maintenance and Support
- 5.2.1.2 Network Design and Integration
- 5.2.2 Components
- 5.2.2.1 Optical Transport Equipment
- 5.2.2.2 Optical Switch
- 5.2.2.3 Optical Platform/Edge ROADM
- 5.2.1 Services
- 5.3 By End-User Vertical
- 5.3.1 IT and Telecom Operators
- 5.3.2 Cloud and Colocation Data Centres
- 5.3.3 Government and Defence
- 5.3.4 Healthcare
- 5.3.5 Banking and Financial Services
- 5.3.6 Other End-User Verticals
- 5.4 By Application
- 5.4.1 Long-Haul DWDM
- 5.4.2 Data-Center-Interconnect
- 5.4.3 Metro Networks
- 5.4.4 Enterprise Networks
- 5.5 By Data Rate / Wavelength
- 5.5.1 100-400 Gbit/s
- 5.5.2 400-800 Gbit/s
- 5.5.3 Beyond 800 Gbit/s
- 5.6 By Geography
- 5.6.1 North America
- 5.6.1.1 United States
- 5.6.1.2 Canada
- 5.6.1.3 Mexico
- 5.6.2 Europe
- 5.6.2.1 Germany
- 5.6.2.2 United Kingdom
- 5.6.2.3 France
- 5.6.2.4 Russia
- 5.6.2.5 Rest of Europe
- 5.6.3 Asia-Pacific
- 5.6.3.1 China
- 5.6.3.2 Japan
- 5.6.3.3 India
- 5.6.3.4 South Korea
- 5.6.3.5 Australia
- 5.6.3.6 Rest of Asia-Pacific
- 5.6.4 Middle East and Africa
- 5.6.4.1 Middle East
- 5.6.4.1.1 Saudi Arabia
- 5.6.4.1.2 United Arab Emirates
- 5.6.4.1.3 Rest of Middle East
- 5.6.4.2 Africa
- 5.6.4.2.1 South Africa
- 5.6.4.2.2 Egypt
- 5.6.4.2.3 Rest of Africa
- 5.6.4.1 Middle East
- 5.6.5 South America
- 5.6.5.1 Brazil
- 5.6.5.2 Argentina
- 5.6.5.3 Rest of South America
- 5.6.1 North America
6 COMPETITIVE LANDSCAPE
- 6.1 Market Concentration
- 6.2 Strategic Moves
- 6.3 Market Share Analysis
- 6.4 Company Profiles (includes Global Level Overview, Market Level Overview, Core Segments, Financials as Available, Strategic Information, Market Rank/Share, Products and Services, Recent Developments)
- 6.4.1 Nokia Corporation
- 6.4.2 Ciena Corporation
- 6.4.3 Cisco Systems, Inc.
- 6.4.4 Huawei Technologies Co., Ltd.
- 6.4.5 Fujitsu Limited
- 6.4.6 ZTE Corporation
- 6.4.7 Infinera Corporation
- 6.4.8 Telefonaktiebolaget LM Ericsson
- 6.4.9 NEC Corporation
- 6.4.10 ADVA Optical Networking SE
- 6.4.11 Ribbon Communications Inc.
- 6.4.12 Tejas Networks Limited
- 6.4.13 Juniper Networks, Inc.
- 6.4.14 Sterlite Technologies Limited
- 6.4.15 Padtec Holding S.A.
- 6.4.16 FiberHome Telecommunication Technologies Co., Ltd.
- 6.4.17 Lumentum Holdings Inc.
- 6.4.18 Coherent Corp.
7 MARKET OPPORTUNITIES AND FUTURE OUTLOOK
- 7.1 White-Space and Unmet-Need Assessment

