PUBLISHER: Mordor Intelligence | PRODUCT CODE: 2122201

PUBLISHER: Mordor Intelligence | PRODUCT CODE: 2122201
Patient Portal - Market Share Analysis, Industry Trends & Statistics, Growth Forecasts (2026 - 2031)
According to Mordor Intelligence, the patient portal market size is projected to expand from USD 6.56 billion in 2025 and USD 7.77 billion in 2026 to USD 18.10 billion by 2031, registering a CAGR of 18.43% between 2026 to 2031.
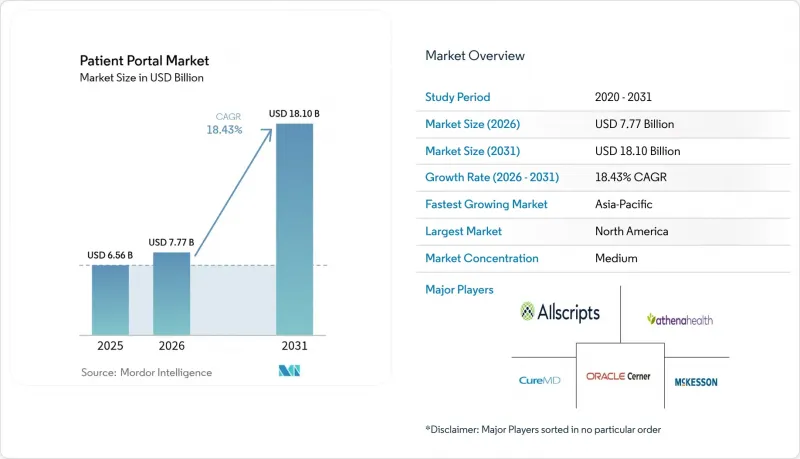
This report is Segmented by Portal Type (Integrated Portals and Stand-Alone Portals), Deployment Mode (Web/On-Premise and Cloud-Based), End User (Providers, Payers, Pharmacies & Retail Health, and Other End Users), and Geography (North America, Europe, Asia-Pacific, Middle East & Africa, and South America). The Market Forecasts are Provided in Terms of Value (USD).
Global Patient Portal Market Trends and Insights
Government Interoperability Regulations
Nationwide frameworks such as the Trusted Exchange Framework and Common Agreement in the United States and the European Health Data Space in the EU require certified EHRs to publish standardized APIs that expose clinical data without special effort. Vendors now face commoditized data access and must differentiate on analytics or user experience. Smaller suppliers lacking API capacity are exiting or merging, whereas Epic Systems and Oracle Health leverage existing FHIR infrastructure to upsell advanced analytics modules. Payers increasingly exploit transparent data flows; one leading U.S. insurer realized USD 340 million in administrative savings after automating prior authorizations through open APIs.
Consumer Demand for Digital Healthcare Access
Smartphone-centric behavior is setting new service benchmarks. A 2025 Pew survey confirmed that 68% of U.S. adults under 50 expect same-day appointment booking and real-time prescription refills via mobile apps. India's Ayushman Bharat Digital Mission has 450 million registered users who access portals tied to a national health identifier, illustrating how government mandates align with consumer expectations. Retail pharmacy chains respond by embedding full-service portals that boosted digital engagement 19% year over year, eroding patient loyalty to traditional practices.
Data Security and Privacy Concerns
The U.S. Department of Health and Human Services logged 725 large-scale breaches in 2024, with portals implicated in 18% due to credential stuffing and session hijacking. Europe's NIS2 Directive requires 24-hour incident reporting and imposes fines up to 2% of global revenue, increasing vendor compliance costs. FaceID authentication, introduced by Epic in late 2025, reduces account takeovers by 34% but increases development complexity for smaller providers. A 2025 Kaiser survey indicates that 41% of adults avoid portals due to privacy concerns, slowing adoption among key demographics.
Other drivers and restraints analyzed in the detailed report include:
- Cloud Adoption in Healthcare IT Systems
- Shift Toward Value-Based Reimbursement Models
- Digital Divide Among Elderly and Rural Populations
For complete list of drivers and restraints, kindly check the Table Of Contents.
Segment Analysis
Integrated offerings commanded 62.88% of the patient portal market in 2025 as enterprise health systems accept bundled portals within EHR license fees. The patient portal market size for integrated solutions is forecast to maintain high absolute revenue, even as it cedes relative share to nimble standalone entrants. Standalone portals, projected to deliver a 20.54% CAGR, benefit from FHIR-based data exchange, which removes historical barriers to vendor swaps. Ambulatory surgery centers, specialty clinics, and retail chains increasingly adopt modular portals that prioritize billing clarity, real-time eligibility checks, and rapid go-live cycles. As a result, the competitive landscape bifurcates: large integrated delivery networks extend bundled contracts, whereas smaller organizations adopt best-of-breed apps.
Standalone suppliers validate demand for specialization. Cedar shortens payment cycles by embedding transparent estimates and flexible plans, while Phreesia automates check-in and intake to lift front-desk throughput 18%. These focused wins attract investors and expand total addressable opportunities, even in hospitals that retain integrated portals for clinical charts but overlay standalone applications for revenue-cycle or intake workflows. Regulatory insistence on open APIs erodes proprietary data moats, ensuring ongoing contest between breadth and specialization inside the patient portal market.
Complete Report Scope:
- By Portal Type
- Integrated Portals
- Stand-Alone Portals
- By Deployment Mode
- Web / On-Premise
- Cloud-Based
- By End User
- Providers (Hospitals, Clinics, IDNs)
- Payers
- Pharmacies & Retail Health
- Other End Users
- Geography
- North America
- United States
- Canada
- Mexico
- Europe
- Germany
- United Kingdom
- France
- Italy
- Spain
- Rest of Europe
- Asia-Pacific
- China
- Japan
- India
- Australia
- South Korea
- Rest of Asia-Pacific
- Middle East & Africa
- GCC
- South Africa
- Rest of Middle East & Africa
- South America
- Brazil
- Argentina
- Rest of South America
- North America
Geography Analysis
North America generated 44.32% of global revenue in 2025 as Medicare and commercial insurers embed digital access metrics into reimbursement contracts, transforming portal activation into a revenue lever. Practices achieving top-quartile engagement receive USD 48,000 more in quality bonuses each year than bottom-quartile peers. Canada pilots similar incentives, while Mexico's public insurer enrolled 18 million users within its first year but struggles with rural adoption.
Asia-Pacific is set to be the fastest expanding region at 19.65% CAGR through 2031. India's national mission compels every empaneled hospital to maintain a portal connected to a universal health identifier, driving large-scale, cloud-native implementations. China integrates portals with social-credit and reimbursement systems, reducing claim cycles from 30 days to 3 days. Australia operates a government backbone that supports 24 million citizens, although a 2024 breach dampened new registrations. South Korea sets a 2026 deadline for tertiary hospitals to adopt FHIR-compliant portals, reflecting regional commitment to standards.
Europe faces moderate momentum because GDPR compliance elevates development expense and health systems remain fragmented. The European Health Data Space standardizes cross-border access, but disparate reimbursement structures slow nationwide deployments. Outside Europe, Gulf Cooperation Council states weave portals into smart-city agendas, while Brazil's national system enrolls 150 million users yet contends with data-quality variability.
- Allscripts Healthcare Solutions (Altera)
- Athenahealth
- Cedar
- eClinicalWorks
- Epic Systems Corp.
- GE Healthcare
- GetWellNetwork
- Greenway Health
- InteliChart
- Luma Health
- McKesson Corp.
- Meditech
- MyHealthONE (HCA Healthcare)
- NextGen Healthcare
- Omada Health
- Oracle Health (Cerner)
- Phreesia
- Koninklijke Philips
- Teladoc Health
- Weave Communications
Additional Benefits:
- The market estimate (ME) sheet in Excel format
- 3 months of analyst support
TABLE OF CONTENTS
1 Introduction
- 1.1 Study Assumptions & Market Definition
- 1.2 Scope of the Study
2 Research Methodology
3 Executive Summary
4 Market Landscape
- 4.1 Market Overview
- 4.2 Market Drivers
- 4.2.1 Government Interoperability Regulations
- 4.2.2 Consumer Demand for Digital Healthcare Access
- 4.2.3 Cloud Adoption in Healthcare IT Systems
- 4.2.4 Shift Toward Value-Based Reimbursement Models
- 4.2.5 Artificial Intelligence Enabled Patient Engagement
- 4.2.6 Open APIs and Health Data Standards Adoption
- 4.3 Market Restraints
- 4.3.1 Data Security and Privacy Concerns
- 4.3.2 Digital Divide Among Elderly and Rural Populations
- 4.3.3 Provider Workflow Burden and Alert Fatigue
- 4.3.4 Uncertain Reimbursement for Virtual Care Services
- 4.4 Value / Supply-Chain Analysis
- 4.5 Regulatory Landscape
- 4.6 Technological Outlook
- 4.7 Porter's Five Forces Analysis
- 4.7.1 Threat of New Entrants
- 4.7.2 Bargaining Power of Suppliers
- 4.7.3 Bargaining Power of Buyers
- 4.7.4 Threat of Substitute Products
- 4.7.5 Competitive Rivalry
5 Market Size & Growth Forecasts (Value, USD)
- 5.1 By Portal Type
- 5.1.1 Integrated Portals
- 5.1.2 Stand-Alone Portals
- 5.2 By Deployment Mode
- 5.2.1 Web / On-Premise
- 5.2.2 Cloud-Based
- 5.3 By End User
- 5.3.1 Providers (Hospitals, Clinics, IDNs)
- 5.3.2 Payers
- 5.3.3 Pharmacies & Retail Health
- 5.3.4 Other End Users
- 5.4 Geography
- 5.4.1 North America
- 5.4.1.1 United States
- 5.4.1.2 Canada
- 5.4.1.3 Mexico
- 5.4.2 Europe
- 5.4.2.1 Germany
- 5.4.2.2 United Kingdom
- 5.4.2.3 France
- 5.4.2.4 Italy
- 5.4.2.5 Spain
- 5.4.2.6 Rest of Europe
- 5.4.3 Asia-Pacific
- 5.4.3.1 China
- 5.4.3.2 Japan
- 5.4.3.3 India
- 5.4.3.4 Australia
- 5.4.3.5 South Korea
- 5.4.3.6 Rest of Asia-Pacific
- 5.4.4 Middle East & Africa
- 5.4.4.1 GCC
- 5.4.4.2 South Africa
- 5.4.4.3 Rest of Middle East & Africa
- 5.4.5 South America
- 5.4.5.1 Brazil
- 5.4.5.2 Argentina
- 5.4.5.3 Rest of South America
- 5.4.1 North America
6 Competitive Landscape
- 6.1 Market Concentration
- 6.2 Market Share Analysis
- 6.3 Company Profiles {(Includes Global Level Overview, Market Level Overview, Core Segments, Financials As Available, Strategic Information, Market Rank/Share For Key Companies, Products & Services, And Recent Developments)}
- 6.3.1 Allscripts Healthcare Solutions (Altera)
- 6.3.2 athenahealth Inc.
- 6.3.3 Cedar
- 6.3.4 eClinicalWorks
- 6.3.5 Epic Systems Corp.
- 6.3.6 GE HealthCare
- 6.3.7 GetWellNetwork
- 6.3.8 Greenway Health
- 6.3.9 InteliChart
- 6.3.10 Luma Health
- 6.3.11 McKesson Corp.
- 6.3.12 MEDITECH
- 6.3.13 MyHealthONE (HCA Healthcare)
- 6.3.14 NextGen Healthcare
- 6.3.15 Omada Health
- 6.3.16 Oracle Health (Cerner)
- 6.3.17 Phreesia
- 6.3.18 Philips Healthcare
- 6.3.19 Teladoc Health
- 6.3.20 Weave Communications
7 Market Opportunities & Future Outlook
- 7.1 White-Space & Unmet-Need Assessment

