PUBLISHER: Mordor Intelligence | PRODUCT CODE: 2122228

PUBLISHER: Mordor Intelligence | PRODUCT CODE: 2122228
Graphic Processors - Market Share Analysis, Industry Trends & Statistics, Growth Forecasts (2026 - 2031)
According to Mordor Intelligence, the graphic processors market size is projected to expand from USD 73.46 billion in 2025 and USD 75.08 billion in 2026 to USD 117.01 billion by 2031, registering a CAGR of 9.28% between 2026 to 2031.
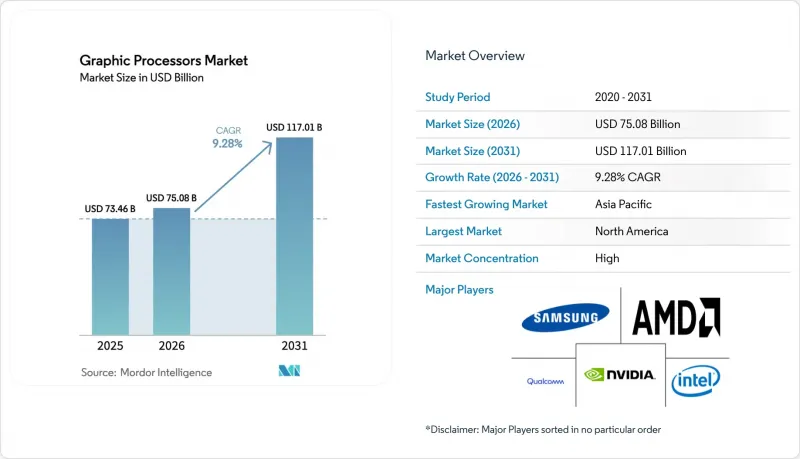
This report is Segmented by GPU Type (Dedicated, Integrated, Hybrid, and External), Deployment Model (On-Premise, and Cloud-As-A-Service), Device Platform (Smartphones, Tablets, Gaming PCs and Consoles, and More), End-User Industry (Consumer Electronics, IT and Telecom, and More), GPU Architecture (x86, ARM, RISC-V, and Proprietary), and Geography. The Market Forecasts are Provided in Terms of Value (USD).
Global Graphic Processors Market Trends and Insights
Surging Demand for AAA Gaming and Real-Time Ray Tracing
Real-time ray tracing has become a baseline expectation, leading vendors to devote up to half of the die area to ray-triangle intersection units that sustain 60 frames-per-second output at 4K resolution. Console refreshes in 2025 injected second-generation ray-tracing cores, lifting the performance floor and pushing discrete GPU roadmaps toward native 8K rendering by 2027. Esports studios are adopting path-traced global illumination to curb artist workloads, tripling compute requirements over raster pipelines and expanding the mid-tier segment priced between USD 400 and USD 700. Subscription cloud gaming platforms now reserve 1.2 GPUs per concurrent user to preserve sub-50-millisecond latency, up from 0.8 in 2024, tightening high-end supply for hyperscale GPU pools. Premium smartphones integrated hybrid ray-tracing blocks in 2025, lifting flagship handset GPU attach rates by 18% year over year.
Proliferation of AI/Deep Learning Workloads
Frontier model training exceeded 10^25 floating-point operations in 2025, prompting clusters with 16,384 accelerators linked via 400 Gb/s fabrics to complete runs within 90 days. Inference is moving from batch to real-time streams, favoring tensor cores optimized for INT8 and FP16 over generic vector units. Hospitals deployed federated learning frameworks across 50-100 sites, raising per-site GPU needs from 2 to 8 units for privacy-preserving diagnostics. Automakers fitted on-vehicle modules with 200-tera-operations-per-second throughput to support over-the-air updates, adding USD 800-USD 1,200 to bill-of-materials and reinforcing premium-trim segmentation. Quantitative trading desks cut strategy development cycles from 6 months to 3 weeks through GPU-based reinforcement learning, triggering 22% deployment growth in 2025 in the graphic processors market.
Advanced-Node Supply Bottlenecks (<=5 nm)
Foundry capacity at 5 nm and below remained tight in 2025, as TSMC allocated 60% of N3 wafer starts to smartphone processors, pushing GPU lead times to 26 weeks for volume orders. Samsung's 3 nm yields hovered near 70%, below cost-competitive thresholds, forcing fallback to 5 nm nodes at 20% lower performance per watt. Intel's Arizona ramp slipped six months, delaying domestic capacity for U.S. designers and prolonging reliance on Taiwan fabrication. Dual-sourcing expansions require 12-18 months of process-co-development, limiting near-term diversification. Wafer price inflation of 8% compounded margin compression and curbed aggressive expansion in the graphic processors market.
Other drivers and restraints analyzed in the detailed report include:
- Expansion of Cloud Gaming and GPU-as-a-Service
- Chiplet and Advanced Packaging Breakthroughs
- High ASPs Limiting Mainstream Adoption
For complete list of drivers and restraints, kindly check the Table Of Contents.
Segment Analysis
Dedicated discrete boards retained a 40.22% stake in 2025 in the graphic processors market, driven by hot-swappable data center cards that simplify maintenance windows. Hybrid accelerators are forecast to grow at a 9.83% CAGR amid demand for unified memory that eliminates PCIe bottlenecks and cuts system power by 25-30%. Integrated GPUs continue to dominate thermally constrained laptops, whereas external enclosures target mobile creatives seeking episodic boosts but are hampered by Thunderbolt bandwidth ceilings that cap utilization at 70-80%.
Chiplet-based hybrids combine 3 nm CPU cores with 5 nm GPU tiles, balancing yield and cost while sustaining competitive throughput. Discrete inference boards introduced sparsity engines that raise effective throughput by up to 60% on transformer models without area penalties. External GPU ecosystems are exploring proprietary connectors to overcome Thunderbolt 5 constraints.
The on-premise segment captured 72.91% of 2025 revenue in the graphic processors market, as latency-sensitive or sovereign workloads remained tethered to local clusters. Cloud-as-a-service is projected to grow 10.02% annually, driven by second-based billing that attracts deep learning experimentation and burst capacity. Financial and healthcare operators keep primary training on site for compliance but burst peak loads to co-located regions, creating hybrid orchestration demand.
Spot GPU prices have varied by 50-80% across zones, prompting workload schedulers to migrate jobs to optimize costs. Lengthening hardware refresh cycles from 3.2 to 4.5 years reflects cautious capital expenditure and software-side efficiency gains. Reserved-capacity contracts offer 35-45% discounts but expose clients to generation-lock-in risk as new silicon lands.
Complete Report Scope:
- By GPU Type
- Dedicated (Discrete) GPUs
- Integrated GPUs
- Hybrid GPUs (APUs)
- External GPUs (eGPU Enclosures)
- By Deployment Model
- On-Premise
- Cloud-as-a-service
- By Device Platform
- Smartphones
- Tablets
- Gaming PCs and Consoles
- Workstations
- Data-center Servers
- Automotive Infotainment and ADAS
- By End-User Industry
- Consumer Electronics
- IT and Telecom
- Media and Entertainment
- Automotive
- Defense and Intelligence
- Healthcare and Life Sciences
- By GPU Architecture
- x86-based GPUs
- ARM-based GPUs
- RISC-V-based GPUs
- Proprietary/Other ISAs
- By Geography
- North America
- United States
- Canada
- Mexico
- South America
- Brazil
- Argentina
- Rest of South America
- Europe
- Germany
- United Kingdom
- France
- Italy
- Spain
- Rest of Europe
- Asia-Pacific
- China
- Japan
- India
- South Korea
- ASEAN
- Rest of Asia-Pacific
- Middle East
- Saudi Arabia
- United Arab Emirates
- Rest of Middle East
- Africa
- South Africa
- Nigeria
- Rest of Africa
- North America
Geography Analysis
North America contributed 37.81% of 2025 revenue, driven by hyperscale build-outs in Virginia, Oregon, and Texas, which accounted for over half of global high-end shipments. Asia-Pacific is projected to expand at an 11.52% CAGR, underpinned by sovereign-AI programs in China and India that prioritize domestic silicon and localized model training. Europe registered moderate growth, as energy tariffs inflated operating expenses by 18-22%, prompting delays in refreshes in the graphic processors market.
Middle East investments established AI-free zones, where the United Arab Emirates and Saudi Arabia commissioned clusters of more than 10,000 accelerators to build Arabic LLMs. Africa and South America contributed under 5% combined, though smartphone GPU attachment in Brazil, Nigeria, and South Africa rose 25-30% with carrier financing expansion.
China's imports fell 12% after high-bandwidth interconnect restrictions, prompting domestic efforts at Alibaba's T-Head and Biren to achieve 70-80% of NVIDIA A100 performance by late-2025. Japan allocated USD 2.3 billion to national AI clusters totaling 15,000 GPUs to train language models without relying on U.S. cloud services. India's semiconductor incentive attracted USD 1.8 billion commitments, though front-end fabs remain three years out. Germany and France co-funded GPU R&D projects but trailed commercial offerings by 18-24 months in power efficiency.
- NVIDIA Corporation
- Advanced Micro Devices, Inc.
- Intel Corporation
- Samsung Electronics Co., Ltd.
- Qualcomm Incorporated
- Apple Inc.
- Arm Ltd.
- Imagination Technologies Limited
- MediaTek Inc.
- VIA Technologies, Inc.
- Taiwan Semiconductor Manufacturing Company Limited
- IBM Corporation
- Sony Group Corporation
- Graphcore Limited
- Tenstorrent Inc.
- ZOTAC Technology Limited
- Micro-Star International Co., Ltd.
- ASUSTeK Computer Inc.
- Giga-Byte Technology Co., Ltd.
- EVGA Corporation
- Blaize, Inc.
- Cerebras Systems Inc.
- Alibaba Group Holding Limited (T-Head)
Additional Benefits:
- The market estimate (ME) sheet in Excel format
- 3 months of analyst support
TABLE OF CONTENTS
1 INTRODUCTION
- 1.1 Study Assumptions and Market Definition
- 1.2 Scope of the Study
2 RESEARCH METHODOLOGY
3 EXECUTIVE SUMMARY
4 MARKET LANDSCAPE
- 4.1 Market Overview
- 4.2 Market Drivers
- 4.2.1 Surging Demand For AAA Gaming and Real-Time Ray Tracing
- 4.2.2 Proliferation Of AI/Deep Learning Workloads
- 4.2.3 Expansion Of Cloud Gaming and GPU-As-A-Service
- 4.2.4 Chiplet and Advanced Packaging Breakthroughs
- 4.2.5 Govt-Backed Exascale Supercomputing Programs
- 4.2.6 Arm/Risc-V Automotive-Grade Custom GPUs
- 4.3 Market Restraints
- 4.3.1 Advanced-Node Supply Bottlenecks (Less than or Equal to 5 Nm)
- 4.3.2 High ASPs Limiting Mainstream Adoption
- 4.3.3 Export Controls On High-End GPUs
- 4.3.4 Thermal Envelope (Greater than 600 W) Deployment Limits
- 4.4 Industry Value Chain Analysis
- 4.5 Regulatory Landscape
- 4.6 Porter's Five Forces Analysis
- 4.6.1 Bargaining Power of Suppliers
- 4.6.2 Bargaining Power of Buyers
- 4.6.3 Threat of New Entrants
- 4.6.4 Threat of Substitutes
- 4.6.5 Intensity of Competitive Rivalry
5 MARKET SIZE AND GROWTH FORECASTS (VALUE)
- 5.1 By GPU Type
- 5.1.1 Dedicated (Discrete) GPUs
- 5.1.2 Integrated GPUs
- 5.1.3 Hybrid GPUs (APUs)
- 5.1.4 External GPUs (eGPU Enclosures)
- 5.2 By Deployment Model
- 5.2.1 On-Premise
- 5.2.2 Cloud-as-a-service
- 5.3 By Device Platform
- 5.3.1 Smartphones
- 5.3.2 Tablets
- 5.3.3 Gaming PCs and Consoles
- 5.3.4 Workstations
- 5.3.5 Data-center Servers
- 5.3.6 Automotive Infotainment and ADAS
- 5.4 By End-User Industry
- 5.4.1 Consumer Electronics
- 5.4.2 IT and Telecom
- 5.4.3 Media and Entertainment
- 5.4.4 Automotive
- 5.4.5 Defense and Intelligence
- 5.4.6 Healthcare and Life Sciences
- 5.5 By GPU Architecture
- 5.5.1 x86-based GPUs
- 5.5.2 ARM-based GPUs
- 5.5.3 RISC-V-based GPUs
- 5.5.4 Proprietary/Other ISAs
- 5.6 By Geography
- 5.6.1 North America
- 5.6.1.1 United States
- 5.6.1.2 Canada
- 5.6.1.3 Mexico
- 5.6.2 South America
- 5.6.2.1 Brazil
- 5.6.2.2 Argentina
- 5.6.2.3 Rest of South America
- 5.6.3 Europe
- 5.6.3.1 Germany
- 5.6.3.2 United Kingdom
- 5.6.3.3 France
- 5.6.3.4 Italy
- 5.6.3.5 Spain
- 5.6.3.6 Rest of Europe
- 5.6.4 Asia-Pacific
- 5.6.4.1 China
- 5.6.4.2 Japan
- 5.6.4.3 India
- 5.6.4.4 South Korea
- 5.6.4.5 ASEAN
- 5.6.4.6 Rest of Asia-Pacific
- 5.6.5 Middle East
- 5.6.5.1 Saudi Arabia
- 5.6.5.2 United Arab Emirates
- 5.6.5.3 Rest of Middle East
- 5.6.6 Africa
- 5.6.6.1 South Africa
- 5.6.6.2 Nigeria
- 5.6.6.3 Rest of Africa
- 5.6.1 North America
6 COMPETITIVE LANDSCAPE
- 6.1 Market Concentration
- 6.2 Strategic Moves
- 6.3 Market Share Analysis
- 6.4 Company Profiles (includes Global level Overview, Market Level Overview, Core Segments, Financials as Available, Strategic Information, Market Rank/Share for Key Companies, Products and Services, and Recent Developments)
- 6.4.1 NVIDIA Corporation
- 6.4.2 Advanced Micro Devices, Inc.
- 6.4.3 Intel Corporation
- 6.4.4 Samsung Electronics Co., Ltd.
- 6.4.5 Qualcomm Incorporated
- 6.4.6 Apple Inc.
- 6.4.7 Arm Ltd.
- 6.4.8 Imagination Technologies Limited
- 6.4.9 MediaTek Inc.
- 6.4.10 VIA Technologies, Inc.
- 6.4.11 Taiwan Semiconductor Manufacturing Company Limited
- 6.4.12 IBM Corporation
- 6.4.13 Sony Group Corporation
- 6.4.14 Graphcore Limited
- 6.4.15 Tenstorrent Inc.
- 6.4.16 ZOTAC Technology Limited
- 6.4.17 Micro-Star International Co., Ltd.
- 6.4.18 ASUSTeK Computer Inc.
- 6.4.19 Giga-Byte Technology Co., Ltd.
- 6.4.20 EVGA Corporation
- 6.4.21 Blaize, Inc.
- 6.4.22 Cerebras Systems Inc.
- 6.4.23 Alibaba Group Holding Limited (T-Head)
7 MARKET OPPORTUNITIES AND FUTURE OUTLOOK
- 7.1 White-space and Unmet-Need Assessment

