PUBLISHER: Mordor Intelligence | PRODUCT CODE: 2122279

PUBLISHER: Mordor Intelligence | PRODUCT CODE: 2122279
Fog Networking - Market Share Analysis, Industry Trends & Statistics, Growth Forecasts (2026 - 2031)
According to Mordor Intelligence, the fog networking market size was valued at USD 0.89 billion in 2025 and estimated to grow from USD 1.08 billion in 2026 to reach USD 2.77 billion by 2031, at a CAGR of 20.78% during the forecast period (2026-2031).
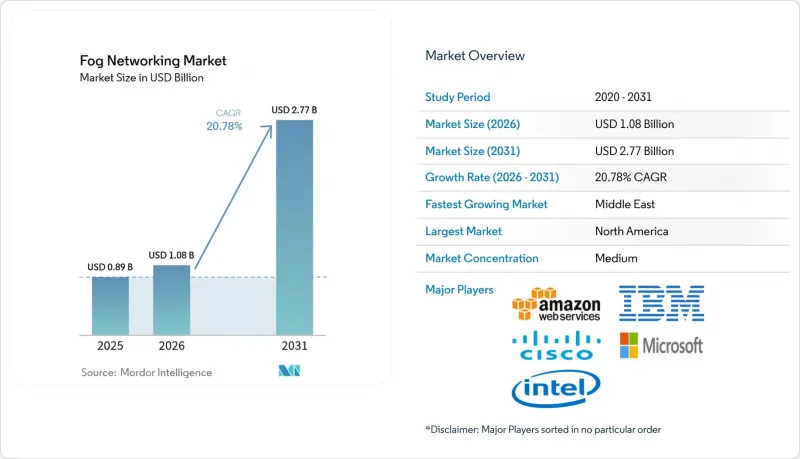
This report is Segmented by Component (Hardware, Software, Service), Deployment Model (On-Premise, Hosted/Managed, and Hybrid), End-User Application (Smart Metering, Smart Metering and More), and Geography. The Market Forecasts are Provided in Terms of Value (USD).
Global Fog Networking Market Trends and Insights
Expanding Real-Time Analytics Demand
Manufacturing organizations deploy fog gateways to run predictive-maintenance models that must respond in less than 10 milliseconds. A Mercedes-Benz plant recorded 82.88% accuracy in forecasting vehicle-test times by applying embedded machine learning at the production edge. Hospitals that shift telemedicine workloads from cloud to on-site fog nodes have cut latency from 100 milliseconds to 5 milliseconds and reduced the attack surface by 35%. Similar latency gains underpin automated warehouse robotics, traffic-signal optimization, and advanced driver-assistance systems. The economic incentive extends beyond speed: energy-efficiency studies show 25-30% lower power use versus centralized processing, reinforcing capital-spending justification.
Proliferation of Low-Cost IoT Sensors
Industrial-grade sensors priced below USD 5 now enable continuous asset monitoring across shop floors and city infrastructure. The Industrial Internet Consortium stresses cost-effective sensor integration as a primary edge-computing catalyst. NIST's IoT Advisory Board likewise classifies distributed architectures as essential for national critical-infrastructure resilience NIST. Cheap sensors feed real-time optimization loops for smart grids, building-energy management, and leakage detection, elevating demand for local analytics capacity embedded in fog nodes.
Security Attack-Surface Complexity
Every distributed node introduces new vulnerabilities that healthcare and manufacturing operators must secure in line with HIPAA and GDPR provisions. The European Defence Agency's CLAUDIA project addresses tactical-edge security frameworks, yet incident-response remains fragmented. In operational-technology environments, breaches risk physical safety, compelling investment in zero-trust architectures and runtime-integrity monitoring across fog clusters.
Other drivers and restraints analyzed in the detailed report include:
- 5G & Wi-Fi 7 Densification
- Edge AI Accelerator Shipments Surge
- Fragmented Orchestration Stacks
For complete list of drivers and restraints, kindly check the Table Of Contents.
Segment Analysis
On-premisess nodes accounted for 45.40% of the 2025 fog networking market share, mirroring strict data-localization mandates in healthcare, finance, and defense. Industries valuing deterministic latency and regulatory control keep compute assets within secured facilities or even inside production lines. Siemens and Microsoft's hybrid architecture combineson-premiseses Industrial Edge runtimes with Azure-based analytics, underscoring demand for flexible oversight.
Hosted fog-as-a-service grows fastest at 25.2% CAGR as managed-service providers bundle lifecycle support, threat-monitoring, and capacity right-sizing. Smaller manufacturers and retailers lacking in-house IT benefit most, accessing advanced AI without purchasing or operating specialized hardware. The fog networking market size for hosted services is projected to triple between 2026 and 2031 as telcos and hyperscale clouds extend service catalogues to field-level computing.
Complete Report Scope:
- By Component (Value, USD)
- Hardware
- Fog gateways
- Edge servers and micro-DCs
- IoT chipsets and accelerators
- Software and Services
- Fog management platform
- Security and orchestration
- Hardware
- By Deployment Model (Value, USD)
- On-premise
- Hosted/Managed
- Hybrid
- By End-user Application (Value, USD)
- Smart Metering
- Building and Home Automation
- Smart Manufacturing
- Connected Healthcare
- Connected Vehicle
- Others (Oil and Gas, Retail, etc.)
- By Geography (Value, USD)
- North America
- United States
- Canada
- Mexico
- South America
- Brazil
- Argentina
- Rest of South America
- Europe
- United Kingdom
- Germany
- France
- Italy
- Rest of Europe
- Asia-Pacific
- China
- Japan
- India
- South Korea
- Rest of Asia-Pacific
- Middle East
- Israel
- Saudi Arabia
- United Arab Emirates
- Turkey
- Rest of Middle East
- Africa
- South Africa
- Egypt
- Rest of Africa
- North America
Geography Analysis
North America led with 36.60% of 2025 revenue, propelled by enterprise digitization budgets, mature 5G coverage, and supportive regulatory clarity. United States start-up ecosystems host 203 edge-computing firms that raised USD 11.1 billion to date Tracxn. Canada's smaller yet vibrant cluster recorded USD 214 million in funding despite a 2024 pullback.
Europe follows, shaped by GDPR and the Digital Markets Act that stress data sovereignty. Parliament debates on communications-infrastructure dependence reinforce investment in indigenous fog stacks Europarl. The continent's industrial pedigree underpins adoption in automotive and heavy machinery; EU-funded pilots show far-edge compute nodes doubling installed-base growth from 2021 to 2027.
The Middle East posts a 26.3% CAGR as smart-city megaprojects in Saudi Arabia and the UAE deploy thousands of roadside sensors and surveillance cameras requiring sub-second analytics. National AI strategies privilege sovereign data processing, catalysing regional data-center and fog-gateway rollouts Across APAC, China's industrial-IoT policy, Japan's robotics leadership, and India's 5G expansion foster sizeable demand. Lower installation labour costs further improve return on investment, accelerating adoption across tier-2 manufacturing hubs.
- Amazon Web Services
- Cisco Systems
- Dell Technologies
- IBM
- Intel
- Microsoft
- Nebbiolo Technologies
- Nokia
- Qualcomm
- Tata Consultancy Services
- Advantech
- HPE
- Huawei
- Arm
- Schneider Electric
- Bosch .IO
- GE Digital
- Saguna Networks
- ClearBlade
- FogHorn (Google)
- EdgeIQ
- Vapor IO
- Fastly
- Equinix Metal
Additional Benefits:
- The market estimate (ME) sheet in Excel format
- 3 months of analyst support
TABLE OF CONTENTS
1 INTRODUCTION
- 1.1 Study Assumptions and Market Definition
- 1.2 Scope of the Study
2 RESEARCH METHODOLOGY
3 EXECUTIVE SUMMARY
4 MARKET LANDSCAPE
- 4.1 Market Overview
- 4.2 Market Drivers
- 4.2.1 Expanding real-time analytics demand
- 4.2.2 Proliferation of low-cost IoT sensors
- 4.2.3 5G and Wi-Fi 7 densification
- 4.2.4 OpenFog/ETSI MEC standard adoption
- 4.2.5 Edge AI accelerator shipments surge
- 4.2.6 National data-sovereignty mandates
- 4.3 Market Restraints
- 4.3.1 Security attack-surface complexity
- 4.3.2 Fragmented orchestration stacks
- 4.3.3 CAPEX burden on brownfield OT sites
- 4.3.4 Limited fog talent pool
- 4.4 Value / Supply-Chain Analysis
- 4.5 Regulatory Landscape
- 4.6 Technological Outlook
- 4.7 Porter's Five Forces Analysis
- 4.7.1 Threat of New Entrants
- 4.7.2 Bargaining Power of Buyers
- 4.7.3 Bargaining Power of Suppliers
- 4.7.4 Threat of Substitutes
- 4.7.5 Intensity of Rivalry
- 4.8 Technology Roadmap
5 MARKET SIZE AND GROWTH FORECASTS (VALUE)
- 5.1 By Component (Value, USD)
- 5.1.1 Hardware
- 5.1.1.1 Fog gateways
- 5.1.1.2 Edge servers and micro-DCs
- 5.1.1.3 IoT chipsets and accelerators
- 5.1.2 Software and Services
- 5.1.2.1 Fog management platform
- 5.1.2.2 Security and orchestration
- 5.1.1 Hardware
- 5.2 By Deployment Model (Value, USD)
- 5.2.1 On-premise
- 5.2.2 Hosted/Managed
- 5.2.3 Hybrid
- 5.3 By End-user Application (Value, USD)
- 5.3.1 Smart Metering
- 5.3.2 Building and Home Automation
- 5.3.3 Smart Manufacturing
- 5.3.4 Connected Healthcare
- 5.3.5 Connected Vehicle
- 5.3.6 Others (Oil and Gas, Retail, etc.)
- 5.4 By Geography (Value, USD)
- 5.4.1 North America
- 5.4.1.1 United States
- 5.4.1.2 Canada
- 5.4.1.3 Mexico
- 5.4.2 South America
- 5.4.2.1 Brazil
- 5.4.2.2 Argentina
- 5.4.2.3 Rest of South America
- 5.4.3 Europe
- 5.4.3.1 United Kingdom
- 5.4.3.2 Germany
- 5.4.3.3 France
- 5.4.3.4 Italy
- 5.4.3.5 Rest of Europe
- 5.4.4 Asia-Pacific
- 5.4.4.1 China
- 5.4.4.2 Japan
- 5.4.4.3 India
- 5.4.4.4 South Korea
- 5.4.4.5 Rest of Asia-Pacific
- 5.4.5 Middle East
- 5.4.5.1 Israel
- 5.4.5.2 Saudi Arabia
- 5.4.5.3 United Arab Emirates
- 5.4.5.4 Turkey
- 5.4.5.5 Rest of Middle East
- 5.4.6 Africa
- 5.4.6.1 South Africa
- 5.4.6.2 Egypt
- 5.4.6.3 Rest of Africa
- 5.4.1 North America
6 COMPETITIVE LANDSCAPE
- 6.1 Market Concentration
- 6.2 Strategic Moves
- 6.3 Market Share Analysis
- 6.4 Company Profiles (includes Global level Overview, Market level overview, Core Segments, Financials as available, Strategic Information, Market Rank/Share, Products and Services, Recent Developments)
- 6.4.1 Amazon Web Services
- 6.4.2 Cisco Systems
- 6.4.3 Dell Technologies
- 6.4.4 IBM
- 6.4.5 Intel
- 6.4.6 Microsoft
- 6.4.7 Nebbiolo Technologies
- 6.4.8 Nokia
- 6.4.9 Qualcomm
- 6.4.10 Tata Consultancy Services
- 6.4.11 Advantech
- 6.4.12 HPE
- 6.4.13 Huawei
- 6.4.14 Arm
- 6.4.15 Schneider Electric
- 6.4.16 Bosch .IO
- 6.4.17 GE Digital
- 6.4.18 Saguna Networks
- 6.4.19 ClearBlade
- 6.4.20 FogHorn (Google)
- 6.4.21 EdgeIQ
- 6.4.22 Vapor IO
- 6.4.23 Fastly
- 6.4.24 Equinix Metal
7 MARKET OPPORTUNITIES AND FUTURE OUTLOOK
- 7.1 White-space and Unmet-need Assessment

