PUBLISHER: Mordor Intelligence | PRODUCT CODE: 2122381

PUBLISHER: Mordor Intelligence | PRODUCT CODE: 2122381
Ion Exchange Resin - Market Share Analysis, Industry Trends & Statistics, Growth Forecasts (2026 - 2031)
According to Mordor Intelligence, the ion exchange resin market size was valued at USD 2.40 billion in 2025 and is estimated to grow from USD 2.48 billion in 2026 to reach USD 3.12 billion by 2031, at a CAGR of 4.70% during the forecast period (2026-2031).
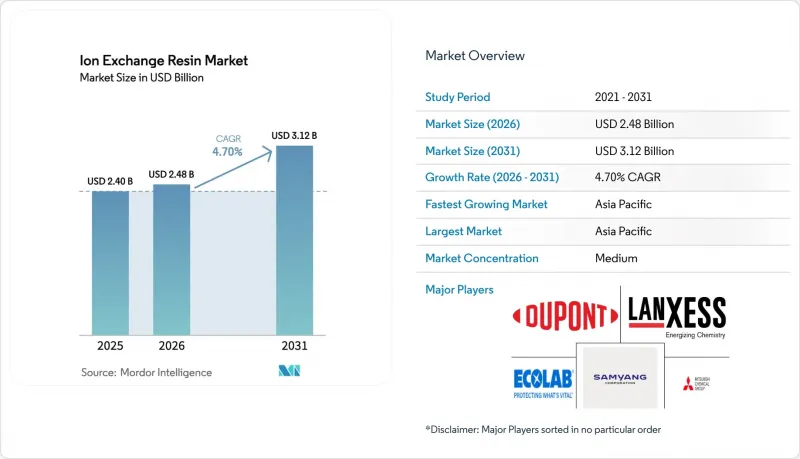
This report is Segmented by Type (Commodity Resins and Specialty Resins), Application Function (Softening and Demineralization, Ultrapure Water Production, and More), End-Use Industry (Water Treatment, Power, Food and Beverage, Pharmaceutical, and More), and Geography (Asia-Pacific, North America, Europe, South America, and Middle East and Africa). The Market Forecasts are Provided in Terms of Value (USD).
Global Ion Exchange Resin Market Trends and Insights
Semiconductor-Grade Ultrapure Water Demand in Asia-Pacific
Fabricating sub-3 nm logic chips requires water with total organic carbon below 1 ppb and resistivity above 18.2 MΩ*cm, a specification met only by nuclear-grade mixed-bed resins. Mitsubishi Chemical disclosed a 15% Diaion capacity expansion in April 2026, aimed at Taiwanese and South Korean foundries now ramping 2 nm production. SEMI standards mandate ion-exchange polishers as the final barrier before photolithography tools, displacing stand-alone membrane loops. China installed more than 200 ultrapure-water systems in 2025, each consuming 10-15 m3 of mixed-bed resin per gigawatt of fab capacity, creating supply-chain risk whenever typhoons delay styrene shipments across East Asia.
PFAS and Heavy-Metal Discharge Limits Boosting Chelating Resins in North America
The U.S. EPA finalized maximum contaminant levels of 4 ppt for PFOA and 10 ppt for PFOS in April 2024, with compliance required by 2029. Type II strong-base anion resins emerged as the best available technology for simultaneous removal of legacy and short-chain PFAS. Utilities in Michigan, New Jersey, and California awarded contracts exceeding USD 300 million in 2025 to retrofit granular-bed systems, even though spent-resin disposal remains unresolved. Parallel Clean Water Act updates tightened lead, cadmium, and chromium limits, accelerating uptake of iminodiacetic- and aminophosphonic-functional resins. Specialty grades now sell at 40-60% price premiums over commodity softening beads.
Volatile Styrene and Acrylic Monomer Prices
Styrene-divinylbenzene copolymers constitute more than 80% of global output, yet styrene traded between USD 1,150 and USD 1,450 t-1 in Asia during 2024-2025, lifting finished-resin costs 6-8%. Acrylic resins used in pharma and food lines face similar volatility after European acrylic-acid prices rose 22% year-on-year in H1 2025. Smaller producers in India and China, reliant on spot feedstock, saw margins compress to 7-9%, forcing consolidation and occasional plant shutdowns.
Other drivers and restraints analyzed in the detailed report include:
- Desalination and ZLD Megaprojects in the Middle East Raising Mixed-Bed Uptake
- Hydrogen-Electrolyzer Incentives Lifting PFSA Membranes in Europe
- European Union Landfill and Incineration Restrictions on Spent Resins
For complete list of drivers and restraints, kindly check the Table Of Contents.
Segment Analysis
Commodity resins delivered 74.35% of 2025 revenue, anchored by boiler-feed softening systems priced at USD 8-12 L-1. However, specialty resins are projected to grow 5.33% annually, eclipsing commodity expansion by 63 bps. Lithium-selective resins launched by Sunresin and LANXESS in 2024-2025 provide Mg:Li selectivity above 100:1, enabling direct extraction from Argentine and Chilean brines. Food-grade variants that meet NSF/ANSI 61 carry USD 3-5 L-1 additional cost yet prevent off-flavor recalls in beverage lines.
Macroporous beads with permanent porosity now dominate sugar-decolorization and antibiotic purification because they resist osmotic shock, extending service life. Continued migration toward compliance-driven chemistries will narrow commodity revenue share by 2031.
Complete Report Scope:
- By Type
- Commodity Resins
- Specialty Resins
- By Application Function
- Softening and Demineralization
- Ultrapure Water Production
- Heavy-Metal Removal and PFAS Mitigation
- Catalysis and Separation (Non-Water)
- Sugar Decolorization and Food and Beverage Purification
- Precious-Metal Recovery and Hydrometallurgy
- By End-use Industry
- Water Treatment
- Power
- Food and Beverage
- Pharmaceutical
- Chemical Processing
- Mining and Metallurgy
- Other End-User Industries
- By Geography
- Asia-Pacific
- China
- India
- Japan
- South Korea
- ASEAN Countries
- Rest of Asia-Pacific
- North America
- United States
- Canada
- Mexico
- Europe
- Germany
- United Kingdom
- Italy
- France
- Rest of Europe
- South America
- Brazil
- Argentina
- Rest of South America
- Middle East and Africa
- Saudi Arabia
- South Africa
- Rest of Middle East and Africa
- Asia-Pacific
Geography Analysis
Asia-Pacific held 34.59% of 2025 revenue and should log a 5.54% CAGR through 2031, paced by semiconductor fabs and lithium-brine projects. China added more than 200 ultrapure-water systems in 2025, each deploying 10-15 m3 of mixed-bed resin per gigawatt of capacity. India's pharmaceutical boom and revised Schedule M water codes are catalyzing mixed-bed upgrades, while ASEAN markets such as Vietnam and Malaysia are attracting greenfield electronics investments. Volatile styrene feedstock-26% price swing peak-to-trough in 2024-2025-compresses margins for producers without vertical integration.
In North America, EPA PFAS rules mean 6-10% of U.S. public water systems will require anion-exchange retrofits by 2029. Canada's oil-sands projects rely on ion exchange to polish produced water, but capex cuts in Alberta curb incremental demand. Mexico's near-shoring inflow is pushing electronics-coating lines that require ultrapure water, expanding the ion exchange resin market across the USMCA corridor.
Europe trails in growth as landfill restrictions raise lifecycle costs, yet the bloc retains a technology edge. EU hydrogen targets of 40 GW electrolyzer capacity by 2030 imply cumulative PFSA membrane demand of 6-8 million m2, though AEM pilots could partially cannibalize PFSA volumes. South America concentrates in Brazil and Argentina, where sugar refining and mining projects drive food-grade and chelating resin adoption. The Middle East and Africa drive demand as desalination and zero-liquid-discharge mandates rolled out across Saudi Arabia, the UAE, and Qatar.
- Anhui Sanxing Resin Co., Ltd.
- Bio-Rad Laboratories, Inc.
- DOSHION POLYSCIENCE PVT. LTD.
- DuPont
- Ecolab
- Eichrom Technologies, LLC
- IEI
- Jacobi Carbons Group
- LANXESS
- Mitsubishi Chemical Group Corporation
- Polymex
- Pure Resin Co., Ltd.
- ResinTech, Inc.
- Samyang Corporation
- Sunresin New Materials Co., Ltd.
- Suqing Group
- Suzhou Bojie Resin Technology Co., Ltd.
- Thermax Limited
- Xylem
Additional Benefits:
- The market estimate (ME) sheet in Excel format
- 3 months of analyst support
TABLE OF CONTENTS
1 Introduction
- 1.1 Study Assumptions and Market Definition
- 1.2 Scope of the Study
2 Research Methodology
3 Executive Summary
4 Market Landscape
- 4.1 Market Overview
- 4.2 Market Drivers
- 4.2.1 Semiconductor-Grade Ultrapure Water Demand in Asia-Pacific
- 4.2.2 PFAS and Heavy-Metal Discharge Limits Boosting Chelating Resins in North America
- 4.2.3 Desalination and ZLD Megaprojects in the Middle East Raising Mixed-Bed Uptake
- 4.2.4 Hydrogen-Electrolyzer Incentives Lifting PFSA Ion-Exchange Membranes in Europe
- 4.2.5 Sugar-Decolorization Boom Driving Food-Grade Resins in South America
- 4.3 Market Restraints
- 4.3.1 Volatile Styrene and Acrylic Monomer Prices
- 4.3.2 Bio-Based Adsorbents Undercutting Resin Economics
- 4.3.3 European Union Landfill and Incineration Restrictions on Spent Resins
- 4.4 Value Chain Analysis
- 4.5 Porter's Five Forces
- 4.5.1 Bargaining Power of Suppliers
- 4.5.2 Bargaining Power of Buyers
- 4.5.3 Threat of New Entrants
- 4.5.4 Threat of Substitutes
- 4.5.5 Industry Rivalry
5 Market Size and Growth Forecasts (Value)
- 5.1 By Type
- 5.1.1 Commodity Resins
- 5.1.2 Specialty Resins
- 5.2 By Application Function
- 5.2.1 Softening and Demineralization
- 5.2.2 Ultrapure Water Production
- 5.2.3 Heavy-Metal Removal and PFAS Mitigation
- 5.2.4 Catalysis and Separation (Non-Water)
- 5.2.5 Sugar Decolorization and Food and Beverage Purification
- 5.2.6 Precious-Metal Recovery and Hydrometallurgy
- 5.3 By End-use Industry
- 5.3.1 Water Treatment
- 5.3.2 Power
- 5.3.3 Food and Beverage
- 5.3.4 Pharmaceutical
- 5.3.5 Chemical Processing
- 5.3.6 Mining and Metallurgy
- 5.3.7 Other End-User Industries
- 5.4 By Geography
- 5.4.1 Asia-Pacific
- 5.4.1.1 China
- 5.4.1.2 India
- 5.4.1.3 Japan
- 5.4.1.4 South Korea
- 5.4.1.5 ASEAN Countries
- 5.4.1.6 Rest of Asia-Pacific
- 5.4.2 North America
- 5.4.2.1 United States
- 5.4.2.2 Canada
- 5.4.2.3 Mexico
- 5.4.3 Europe
- 5.4.3.1 Germany
- 5.4.3.2 United Kingdom
- 5.4.3.3 Italy
- 5.4.3.4 France
- 5.4.3.5 Rest of Europe
- 5.4.4 South America
- 5.4.4.1 Brazil
- 5.4.4.2 Argentina
- 5.4.4.3 Rest of South America
- 5.4.5 Middle East and Africa
- 5.4.5.1 Saudi Arabia
- 5.4.5.2 South Africa
- 5.4.5.3 Rest of Middle East and Africa
- 5.4.1 Asia-Pacific
6 Competitive Landscape
- 6.1 Market Concentration
- 6.2 Strategic Moves
- 6.3 Market Share/Ranking Analysis
- 6.4 Company Profiles (includes Global-level Overview, Market-level Overview, Core Segments, Financials as available, Strategic Information, Market Rank/Share, Products and Services, and Recent Developments)
- 6.4.1 Anhui Sanxing Resin Co., Ltd.
- 6.4.2 Bio-Rad Laboratories, Inc.
- 6.4.3 DOSHION POLYSCIENCE PVT. LTD.
- 6.4.4 DuPont
- 6.4.5 Ecolab
- 6.4.6 Eichrom Technologies, LLC
- 6.4.7 IEI
- 6.4.8 Jacobi Carbons Group
- 6.4.9 LANXESS
- 6.4.10 Mitsubishi Chemical Group Corporation
- 6.4.11 Polymex
- 6.4.12 Pure Resin Co., Ltd.
- 6.4.13 ResinTech, Inc.
- 6.4.14 Samyang Corporation
- 6.4.15 Sunresin New Materials Co., Ltd.
- 6.4.16 Suqing Group
- 6.4.17 Suzhou Bojie Resin Technology Co., Ltd.
- 6.4.18 Thermax Limited
- 6.4.19 Xylem
7 Market Opportunities and Future Outlook
- 7.1 White-space and Unmet-Need Assessment
- 7.2 Growing Demand for Fuel Cells

