PUBLISHER: Mordor Intelligence | PRODUCT CODE: 2122384

PUBLISHER: Mordor Intelligence | PRODUCT CODE: 2122384
Personal Care Chemicals - Market Share Analysis, Industry Trends & Statistics, Growth Forecasts (2026 - 2031)
According to Mordor Intelligence, the personal care chemicals market size is expected to increase from USD 17.45 billion in 2025 to USD 18.31 billion in 2026 and reach USD 23.30 billion by 2031, growing at a CAGR of 4.94% over 2026-2031.
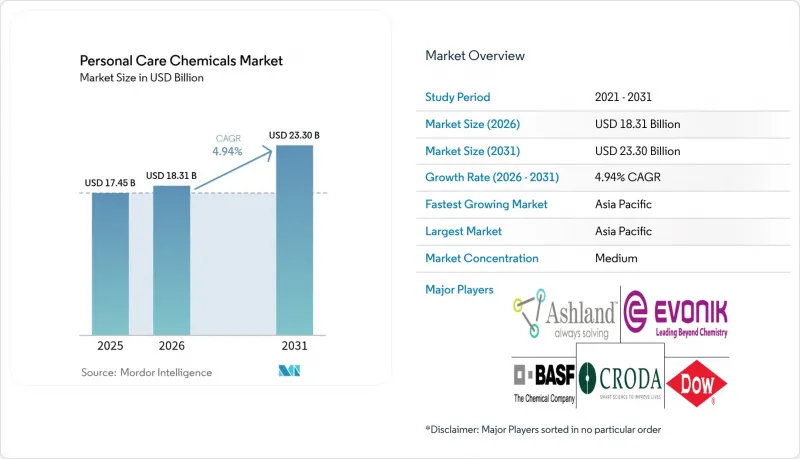
This report is Segmented by Ingredient (Inactive Ingredients and Active Ingredients), Application (Skin Care, Hair Care, Make-Up, Fragrances, Oral Care, and Toiletries), and Geography (Asia-Pacific, North America, Europe, South America, and Middle-East and Africa). The Market Forecasts are Provided in Terms of Value (USD).
Global Personal Care Chemicals Market Trends and Insights
Asia-Pacific Middle-Class Spending Boom
Urban household disposable income in India and China rose 7-9% annually during 2024-2025, lifting per-capita spending on premium skin-care and color-cosmetics products that rely on niacinamide, tranexamic acid, and encapsulated retinol. South Korea's K-beauty exports increased 14% in 2025, driving peptide and centella asiatica orders across ASEAN markets. Japan's functional-cosmetics category-which requires quasi-drug approval-grew 11% in 2024, steering suppliers toward clinical-grade actives that meet MHLW standards. The ISO 22716 GMP framework is gaining traction region-wide, smoothing multi-country product registrations. Collectively, these shifts underpin the personal care chemicals market's fastest regional expansion.
Natural and Sustainable Ingredient Shift (RSPO, COSMOS)
RSPO-certified palm-derived inputs reached 1.2 million metric tons in 2024 after L'Oreal, Unilever, and Procter & Gamble pledged 100% certification by 2026. COSMOS approvals climbed 22% in 2025, prompting BASF to invest EUR 50 million in bio-based surfactant capacity at Ludwigshafen. Croda's 2024 acquisition of Alban Muller secured upcycled plant actives from grape pomace and olive-mill waste, broadening its sustainable portfolio. Brands now ask for carbon-footprint data at the ingredient level, a transparency leap that favors suppliers with integrated traceability platforms. EU Ecolabel and REACH updates reinforce this trajectory in Europe.
Petro-Derivative Cost Volatility
Palm-oil prices ranged between USD 950 and USD 1,180 per metric ton during 2024-2025, driven by Indonesia's biodiesel mandate and El Nino yield losses, raising costs for sodium lauryl sulfate and other palm-kernel-based surfactants. Ethylene oxide spot spikes added pressure to ethoxylated emulsifiers, and Stepan's surfactant margin dropped 240 basis points in 2024. Larger suppliers hedge volatility, but smaller formulators often pass costs to consumers or exit, accelerating consolidation such as Nouryon's 2024 purchase of two Southeast Asian toll manufacturers. Bio-based surfactants offer a partial buffer but remain premium-priced for mass-market products.
Other drivers and restraints analyzed in the detailed report include:
- E-Commerce Acceleration of Niche Beauty Brands
- AI-Driven Formulation and Predictive Toxicology
- Water-Scarcity Limits on Rinse-Off Formats
For complete list of drivers and restraints, kindly check the Table Of Contents.
Segment Analysis
Inactive ingredients captured 61.72% of personal care chemicals market value in 2025, led by surfactants, emulsifiers, and emollients that supply critical cleansing, stabilization, and sensorial functions. Emulsifiers such as polysorbates and glyceryl stearates stabilize oil-in-water creams, while emollients-fatty alcohols, esters, and silicones-deliver glide and barrier repair. Rising consumer preference for clean-label cosmetics is pushing the shift from synthetic colorants toward natural beetroot and turmeric pigments, especially in Europe and North America. Rheology modifiers, including carbomers and xanthan gum, maintain viscosity across a wide pH range.
Active ingredients, forecast to grow at 5.31% CAGR, are closing the revenue gap as brands emphasize clinical efficacy. Conditioning agents such as quats and silicone derivatives remain staples for hair-care products, and bond-repair polymer adoption has expanded beyond salon channels. UV filters command premium pricing; regulatory scrutiny of avobenzone and octocrylene is hastening mineral alternative uptake. Powerful anti-aging actives-retinoids, peptides, niacinamide, antioxidants-win price premiums because they deliver measurable benefits, as shown by Croda's Matrigenics.14G peptide improving skin elasticity by 23% in a 12-week trial. Exfoliants such as alpha- and beta-hydroxy acids are thriving in Asia-Pacific brightening regimens. ISO 22716 and COSMOS certifications increasingly shape procurement decisions, aligning suppliers with premium-brand expectations for safety and sustainability within the personal care chemicals market.
Complete Report Scope:
- By Ingredient
- Inactive Ingredients
- Surfactants
- Emulsifiers
- Emollients
- Colorants and Preservatives
- Rheology Control Agents
- Other Inactive Ingredients
- Active Ingredients
- Conditioning Agents
- UV Ingredients
- Anti-ageing Agents
- Exfoliants
- Other Active Ingredients
- Inactive Ingredients
- By Application
- Skin Care
- Hair Care
- Make-up
- Fragrances
- Oral Care
- Toiletries
- By Geography
- Asia-Pacific
- China
- India
- Japan
- South Korea
- ASEAN Countries
- Rest of Asia-Pacific
- North America
- United States
- Canada
- Mexico
- Europe
- Germany
- United Kingdom
- France
- Spain
- Italy
- NORDIC Countries
- Rest of Europe
- South America
- Brazil
- Argentina
- Rest of South America
- Middle-East and Africa
- Saudi Arabia
- South Africa
- Rest of Middle-East and Africa
- Asia-Pacific
Geography Analysis
Asia-Pacific contributed 30.21% of personal care chemicals market value in 2025 and is set to grow at 6.12% CAGR, fueled by income growth, urbanization, and regulatory streamlining. China's 2024 NMPA reforms waived animal testing for many imported products when ISO 22716 is in place, accelerating ingredient launches. India's cosmetics sales grew 11% in 2024, and local brands increasingly procure sustainable turmeric and neem actives, while global suppliers invest in bio-based surfactant plants to meet large rinse-off demand. South Korea's K-beauty exports and Japan's quasi-drug approvals propel demand for clinical-grade actives across ASEAN, where Solvay and Nouryon recently added capacity. Contract manufacturing hubs in Thailand and Vietnam cater to regional and Australian requirements, and ISO 22716 certification is becoming a passport for premium-brand entry.
North America remains an innovation center, though growth trails global averages. MoCRA mandates facility registration and adverse-event reporting, adding 8-12% compliance overhead for mid-tier formulators. California's Proposition 65 and forthcoming New York disclosure rules increase state-level complexity, while Canadian harmonization supports cross-border trade. Europe's REACH and Cosmetics Regulation continue to shape global standards; recent restrictions on octocrylene, homosalate, and parabens pivot R&D toward mineral UV filters and microbiome-friendly preservatives. Germany, France, and the United Kingdom spearhead RSPO adoption, and Nordic countries pioneer waterless formats and circular-economy sourcing.
South America and Middle-East and Africa contribute smaller share but show niche potential. Brazil's ingredient imports are growing, supporting textured-hair surfactants and conditioning agents. Argentina's volatile macro climate curbs demand, but local soy- and sunflower-based surfactants serve regional needs. Gulf Cooperation Council markets combine high disposable income with halal and water-conservation priorities, boosting anhydrous formats suited to arid climates. South Africa's brands exploit indigenous botanicals such as marula and rooibos for local and export use, reinforcing biodiversity as a differentiator in the personal care chemicals market.
- Ashland
- BASF
- Clariant
- Croda International Plc
- Dow
- DSM
- Evonik Industries AG
- GALAXY
- Innospec
- Kao Corporation
- Lonza
- Merck KGaA
- Momentive
- Nouryon
- Sasol
- Solvay
- Stepan Company
- Symrise
- The Lubrizol Corporation
- Wacker Chemie AG
Additional Benefits:
- The market estimate (ME) sheet in Excel format
- 3 months of analyst support
TABLE OF CONTENTS
1 Introduction
- 1.1 Study Assumptions and Market Definition
- 1.2 Scope of the Study
2 Research Methodology
3 Executive Summary
4 Market Landscape
- 4.1 Market Overview
- 4.2 Market Drivers
- 4.2.1 Asia-Pacific middle-class spending boom
- 4.2.2 Natural and sustainable ingredient shift (RSPO, COSMOS)
- 4.2.3 E-commerce acceleration of niche beauty brands
- 4.2.4 AI-driven formulation and predictive toxicology
- 4.2.5 Fermentation-based "carbon-upcycled" actives
- 4.3 Market Restraints
- 4.3.1 Petro-derivative cost volatility
- 4.3.2 Water-scarcity limits on rinse-off formats
- 4.3.3 Traceability mandates (MoCRA-style) squeezing SME margins
- 4.4 Value Chain Analysis
- 4.5 Porter's Five Forces
- 4.5.1 Bargaining Power of Suppliers
- 4.5.2 Bargaining Power of Consumers
- 4.5.3 Threat of New Entrants
- 4.5.4 Threat of Substitutes
- 4.5.5 Degree of Competition
5 Market Size and Growth Forecasts (Value)
- 5.1 By Ingredient
- 5.1.1 Inactive Ingredients
- 5.1.1.1 Surfactants
- 5.1.1.2 Emulsifiers
- 5.1.1.3 Emollients
- 5.1.1.4 Colorants and Preservatives
- 5.1.1.5 Rheology Control Agents
- 5.1.1.6 Other Inactive Ingredients
- 5.1.2 Active Ingredients
- 5.1.2.1 Conditioning Agents
- 5.1.2.2 UV Ingredients
- 5.1.2.3 Anti-ageing Agents
- 5.1.2.4 Exfoliants
- 5.1.2.5 Other Active Ingredients
- 5.1.1 Inactive Ingredients
- 5.2 By Application
- 5.2.1 Skin Care
- 5.2.2 Hair Care
- 5.2.3 Make-up
- 5.2.4 Fragrances
- 5.2.5 Oral Care
- 5.2.6 Toiletries
- 5.3 By Geography
- 5.3.1 Asia-Pacific
- 5.3.1.1 China
- 5.3.1.2 India
- 5.3.1.3 Japan
- 5.3.1.4 South Korea
- 5.3.1.5 ASEAN Countries
- 5.3.1.6 Rest of Asia-Pacific
- 5.3.2 North America
- 5.3.2.1 United States
- 5.3.2.2 Canada
- 5.3.2.3 Mexico
- 5.3.3 Europe
- 5.3.3.1 Germany
- 5.3.3.2 United Kingdom
- 5.3.3.3 France
- 5.3.3.4 Spain
- 5.3.3.5 Italy
- 5.3.3.6 NORDIC Countries
- 5.3.3.7 Rest of Europe
- 5.3.4 South America
- 5.3.4.1 Brazil
- 5.3.4.2 Argentina
- 5.3.4.3 Rest of South America
- 5.3.5 Middle-East and Africa
- 5.3.5.1 Saudi Arabia
- 5.3.5.2 South Africa
- 5.3.5.3 Rest of Middle-East and Africa
- 5.3.1 Asia-Pacific
6 Competitive Landscape
- 6.1 Market Concentration
- 6.2 Strategic Moves
- 6.3 Market Share(%)/Ranking Analysis
- 6.4 Company Profiles (includes Global level Overview, Market level overview, Core Segments, Financials as available, Strategic Information, Products and Services, and Recent Developments)
- 6.4.1 Ashland
- 6.4.2 BASF
- 6.4.3 Clariant
- 6.4.4 Croda International Plc
- 6.4.5 Dow
- 6.4.6 DSM
- 6.4.7 Evonik Industries AG
- 6.4.8 GALAXY
- 6.4.9 Innospec
- 6.4.10 Kao Corporation
- 6.4.11 Lonza
- 6.4.12 Merck KGaA
- 6.4.13 Momentive
- 6.4.14 Nouryon
- 6.4.15 Sasol
- 6.4.16 Solvay
- 6.4.17 Stepan Company
- 6.4.18 Symrise
- 6.4.19 The Lubrizol Corporation
- 6.4.20 Wacker Chemie AG
7 Market Opportunities and Future Outlook
- 7.1 White-space and Unmet-Need Assessment

