PUBLISHER: Mordor Intelligence | PRODUCT CODE: 2122533

PUBLISHER: Mordor Intelligence | PRODUCT CODE: 2122533
Product Information Management (PIM) - Market Share Analysis, Industry Trends & Statistics, Growth Forecasts (2026 - 2031)
According to Mordor Intelligence, the product information management market size stands at USD 19.95 billion in 2026 and is projected to reach USD 37.39 billion by 2031, registering a 13.38% CAGR through the forecast period.
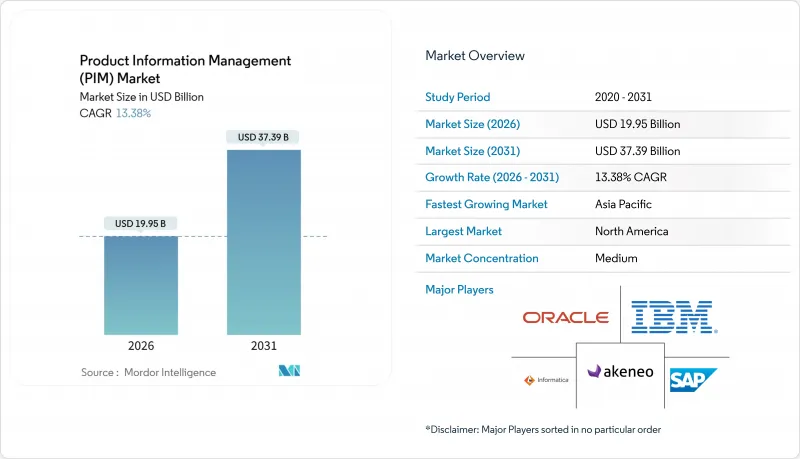
This report is Segmented by Deployment Model (Cloud, and On-Premise), Offering (Solutions, and Services), Organization Size (Large Enterprises, and Small and Medium Enterprises), End-User Industry (Retail and E-Commerce, BFSI, Manufacturing, Media and Entertainment, and IT and Telecom), and Geography. The Market Forecasts are Provided in Terms of Value (USD).
Global Product Information Management (PIM) Market Trends and Insights
E-Commerce Boom And SKU Proliferation
Explosive SKU counts strain legacy spreadsheets, prompting retailers to centralize product attributes in cloud hubs that syndicate accurate data to web, mobile, and store systems. Shopify merchants handling more than 10,000 SKUs experienced a 23% revenue loss when information was incomplete, a gap closed by automated enrichment and marketplace feeds. Instacart and other quick-commerce operators require sub-hour API updates, so suppliers integrate real-time PIM webhooks to stay listed. AI engines from Akeneo extract attributes from supplier PDFs and translate descriptions, cutting manual effort 60% and shrinking onboarding cycles from weeks to days. Demand peaks in Asia-Pacific, where Lazada and Tokopedia rapidly expand assortments, and in North America, where buy-online-pick-up-in-store programs require synchronized product and inventory views.
Cloud adoption lowering TCO
Enterprises shifting to cloud platforms avoid hardware capital expense, reduce IT head-count, and match operating cost to seasonal volume. Total cost of ownership falls 30-40% within three years by eliminating manual upgrades and by automating security patches. Mid-market firms with fewer than 1,000 employees adopt cloud PIM twice as fast as large peers because subscription tiers and pre-built Shopify or Salesforce connectors compress deployment from 12-18 months on-premise to as little as 12 weeks. Industry templates such as GS1-compliant data models speed integration with suppliers. These benefits drive the 18.50% CAGR in cloud deployments yet raise data-residency and sovereignty questions that vendors mitigate through regional hosting options and ISO 27001 controls.
Cybersecurity And Data-Breach Concerns
Centralized cloud repositories become attractive to ransomware groups because they store proprietary formulations, prices, and supplier terms. The EUR 1.2 billion GDPR penalty levied on Meta in 2023 underscores potential exposure when data crosses borders without airtight controls. Vendors answer with zero-trust architectures, granular encryption, and optional regional hosting, yet every API link to Shopify, Amazon, or Instagram multiplies the attack surface. Regulated verticals such as banking and pharma demand configurable masking and consent modules, adding deployment friction. The near-term drag is strongest in Europe and North America where disclosure laws force rapid public reporting of breaches.
Other drivers and restraints analyzed in the detailed report include:
- Omnichannel customer-experience mandates
- EU Digital Product Passport Compliance
- Integration complexity with legacy ERPs
For complete list of drivers and restraints, kindly check the Table Of Contents.
Segment Analysis
Cloud deployments generated 63.50% revenue share in 2025, outstripping on-premise alternatives through subscription economics and elastic scale that match peak demand around shopping holidays. The Product Information Management market size attributable to cloud solutions is forecast to rise at an 18.50% CAGR, making cloud both the largest and quickest-growing model. Retailers appreciate managed upgrades and 24-hour global availability that support always-on catalog syndication. On-premise share continues to fall because capital expense, extended implementation, and laborious patching no longer match board-level mandates for speed and resilience.
Hybrid configurations persist in pharmaceuticals, aerospace, and defense where data sovereignty or air-gapped networks remain non-negotiable. These firms keep sensitive BOM data on internal servers while leveraging cloud-based enrichment and distribution micro-services. Generative AI modules now bundled with Salsify, Stibo Systems, and Syndigo run more economically at cloud scale, further widening the capability gap. The market story therefore shifts from a binary cloud versus on-premise debate to a continuum in which full SaaS dominates routine use cases while edge deployments serve regulated corners.
Solutions still delivered 63.14% of Product Information Management market revenue in 2025, covering software subscriptions and license maintenance. However, services - implementation, custom integration, training, and managed operations - are rising at a 23.40% CAGR through 2031, outpacing software itself. Organizations repeatedly underestimate the taxonomy design, data-quality remediation, and stakeholder alignment needed to operationalize PIM. Consulting firms step in to cleanse legacy catalogs, build MuleSoft connectors, and coach category teams on attribute governance. As a result, the Product Information Management market size for services is expanding faster than licenses.
Managed services answer the chronic shortage of PIM data stewards. Brands outsource routine content health checks, marketplace feed monitoring, and compliance audits to specialists for a monthly fee. This outsourcing trend will taper only when low-code workflow builders, AI data-quality bots, and self-service mapping reduce human intervention. Until then, services revenue remains the primary tailwind because Digital Product Passport mandates and omnichannel feeds require ongoing updates rather than one-time projects.
Complete Report Scope:
- By Deployment Model
- Cloud
- On-Premise
- By Offering
- Solutions
- Services
- By Organization Size
- Large Enterprises
- Small and Medium Enterprises (SMEs)
- By End-User Industry
- Retail and E-commerce
- BFSI
- Manufacturing
- Media and Entertainment
- IT and Telecom
- Other End-User Industries
- By Geography
- North America
- United States
- Canada
- Mexico
- Europe
- Germany
- United Kingdom
- France
- Italy
- Spain
- Russia
- Rest of Europe
- Asia-Pacific
- China
- Japan
- India
- South Korea
- Australia
- Rest of Asia-Pacific
- Middle East
- Saudi Arabia
- United Arab Emirates
- Turkey
- Rest of Middle East
- Africa
- South Africa
- Nigeria
- Rest of Africa
- South America
- Brazil
- Argentina
- Rest of South America
- North America
Geography Analysis
North America contributed 39.80% of global revenue in 2025, buoyed by concentrated retail chains, high digital-adoption rates, and early uptake of master data governance. Many large enterprises completed first-generation PIM rollouts and now upgrade to AI-native versions that generate copy, translate descriptions, and score data quality automatically. Vendor competition intensifies in mid-market tiers, where Shopify-based brands and Amazon third-party sellers demand low-friction onboarding and affordable licenses. U.S. privacy proposals, such as the California Consumer Privacy Act, also increase demand for lineage tracking and consent auditing within PIM workflows.
Asia-Pacific is the growth engine, posting a 20.10% CAGR as China, India, and Southeast Asia digitize trade and payments. GS1 standards integrated into Baidu search improve discoverability while filtering counterfeits, driving manufacturers to structure product data rigorously. India's Open Network for Digital Commerce sets open catalog formats that small merchants must adopt to participate. Japan and South Korea embed QR codes with recycling instructions to support sustainability goals for an aging population. Language diversity, proprietary schemas on Lazada or Coupang, and varied data-hosting laws compel vendors to deliver multi-tenant, rules-driven transformation logic.
Europe remains compliance-centric. The Corporate Sustainability Reporting Directive and Digital Product Passport scheme force PIM upgrades that add carbon footprint, repairability, and circularity fields. Export-oriented manufacturers in Turkey, Morocco, and Vietnam also modernize to maintain EU access, creating secondary demand pockets. South America's adoption concentrates in Brazil and Argentina where Mercado Libre and Falabella enforce structured listing rules. The Middle East shows momentum in UAE and Saudi Arabia, catalyzed by state-sponsored e-commerce strategies and fast-growing regional marketplaces. Africa remains nascent but rising smartphone penetration in Nigeria and South Africa signals early green shoots for PIM vendors targeting mobile-first catalogs.
- SAP SE
- IBM Corp.
- Oracle Corp.
- Pimcore GmbH
- Salsify Inc.
- Syndigo LLC
- Stibo Systems A/S
- inRiver AB
- Akeneo SAS
- Contentserv AG
- Bluestone PIM AS
- Precisely Holdings LLC
- Plytix Ltd.
- InsightSoftware LLC
- Riversand (Syndigo)
- Informatica LLC
- Pimberly Ltd.
- Adobe Inc. (Experience Manager Assets)
- Acquia Inc.
- Ergonode Sp. z o.o.
- Productsup GmbH
- Sales Layer SL
Additional Benefits:
- The market estimate (ME) sheet in Excel format
- 3 months of analyst support
TABLE OF CONTENTS
1 INTRODUCTION
- 1.1 Study Assumptions and Market Definition
- 1.2 Scope of the Study
2 RESEARCH METHODOLOGY
3 EXECUTIVE SUMMARY
4 MARKET LANDSCAPE
- 4.1 Market Overview
- 4.2 Market Drivers
- 4.2.1 E-commerce Boom and SKU Proliferation
- 4.2.2 Cloud Adoption Lowering TCO
- 4.2.3 Omnichannel Customer-Experience Mandates
- 4.2.4 EU Digital Product Passport Compliance
- 4.2.5 Gen-AI-Ready Product-Content Pipelines
- 4.2.6 Marketplace Quick-Commerce API Requirements
- 4.3 Market Restraints
- 4.3.1 Cybersecurity and Data-Breach Concerns
- 4.3.2 Integration Complexity with Legacy ERPs
- 4.3.3 Rising ESG Data-Audit Costs
- 4.3.4 Shortage of PIM-Skilled Data Stewards
- 4.4 Industry Value Chain Analysis
- 4.5 Regulatory Landscape
- 4.6 Technological Outlook
- 4.7 Impact of Macroeconomic Factors
- 4.8 Porter's Five Forces Analysis
- 4.8.1 Threat of New Entrants
- 4.8.2 Bargaining Power of Suppliers
- 4.8.3 Bargaining Power of Buyers
- 4.8.4 Threat of Substitutes
- 4.8.5 Competitive Rivalry
5 MARKET SIZE AND GROWTH FORECASTS (VALUE)
- 5.1 By Deployment Model
- 5.1.1 Cloud
- 5.1.2 On-Premise
- 5.2 By Offering
- 5.2.1 Solutions
- 5.2.2 Services
- 5.3 By Organization Size
- 5.3.1 Large Enterprises
- 5.3.2 Small and Medium Enterprises (SMEs)
- 5.4 By End-User Industry
- 5.4.1 Retail and E-commerce
- 5.4.2 BFSI
- 5.4.3 Manufacturing
- 5.4.4 Media and Entertainment
- 5.4.5 IT and Telecom
- 5.4.6 Other End-User Industries
- 5.5 By Geography
- 5.5.1 North America
- 5.5.1.1 United States
- 5.5.1.2 Canada
- 5.5.1.3 Mexico
- 5.5.2 Europe
- 5.5.2.1 Germany
- 5.5.2.2 United Kingdom
- 5.5.2.3 France
- 5.5.2.4 Italy
- 5.5.2.5 Spain
- 5.5.2.6 Russia
- 5.5.2.7 Rest of Europe
- 5.5.3 Asia-Pacific
- 5.5.3.1 China
- 5.5.3.2 Japan
- 5.5.3.3 India
- 5.5.3.4 South Korea
- 5.5.3.5 Australia
- 5.5.3.6 Rest of Asia-Pacific
- 5.5.4 Middle East
- 5.5.4.1 Saudi Arabia
- 5.5.4.2 United Arab Emirates
- 5.5.4.3 Turkey
- 5.5.4.4 Rest of Middle East
- 5.5.5 Africa
- 5.5.5.1 South Africa
- 5.5.5.2 Nigeria
- 5.5.5.3 Rest of Africa
- 5.5.6 South America
- 5.5.6.1 Brazil
- 5.5.6.2 Argentina
- 5.5.6.3 Rest of South America
- 5.5.1 North America
6 COMPETITIVE LANDSCAPE
- 6.1 Market Concentration
- 6.2 Strategic Moves
- 6.3 Market Share Analysis
- 6.4 Company Profiles (includes Global level Overview, Market level overview, Core Segments, Financials as available, Strategic Information, Market Rank/Share for key companies, Products and Services, and Recent Developments)
- 6.4.1 SAP SE
- 6.4.2 IBM Corp.
- 6.4.3 Oracle Corp.
- 6.4.4 Pimcore GmbH
- 6.4.5 Salsify Inc.
- 6.4.6 Syndigo LLC
- 6.4.7 Stibo Systems A/S
- 6.4.8 inRiver AB
- 6.4.9 Akeneo SAS
- 6.4.10 Contentserv AG
- 6.4.11 Bluestone PIM AS
- 6.4.12 Precisely Holdings LLC
- 6.4.13 Plytix Ltd.
- 6.4.14 InsightSoftware LLC
- 6.4.15 Riversand (Syndigo)
- 6.4.16 Informatica LLC
- 6.4.17 Pimberly Ltd.
- 6.4.18 Adobe Inc. (Experience Manager Assets)
- 6.4.19 Acquia Inc.
- 6.4.20 Ergonode Sp. z o.o.
- 6.4.21 Productsup GmbH
- 6.4.22 Sales Layer SL
7 MARKET OPPORTUNITIES AND FUTURE OUTLOOK
- 7.1 White-Space and Unmet-Need Assessment

