PUBLISHER: Mordor Intelligence | PRODUCT CODE: 2122582

PUBLISHER: Mordor Intelligence | PRODUCT CODE: 2122582
Laboratory Filtration - Market Share Analysis, Industry Trends & Statistics, Growth Forecasts (2026 - 2031)
According to Mordor Intelligence, the laboratory filtration market size is estimated at USD 5.01 billion in 2026, and is expected to reach USD 7.58 billion by 2031, at a CAGR of 8.63% during the forecast period (2026-2031).
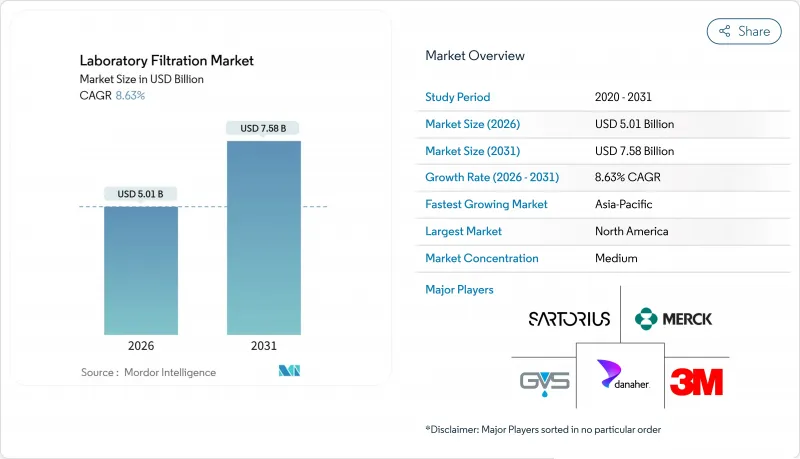
This report is Segmented by Product Type (Filtration Media, Filtration Assemblies, Filtration Accessories), Technique (Microfiltration, Ultrafiltration, and More), End User (Pharmaceutical & Biotechnology Companies, and More), and Geography (North America, Europe, Asia-Pacific, Middle East & Africa, South America). The Market Forecasts are Provided in Terms of Value (USD).
Global Laboratory Filtration Market Trends and Insights
Accelerating Biopharma R&D Spend
Global pharmaceutical R&D reached USD 244 billion in 2025, a 7.5% increase year-over-year, with biologics accounting for 62% of this expenditure. Each investigational new drug submission now triggers 15-20 sterility and viral clearance validation runs, which translates into a membrane area equivalent to three to five production batches. Contract laboratories experienced a 28% increase in sample throughput for stability testing, prompting procurement managers to negotiate long-term filtration-media agreements that secure price and availability. Regulators continue to refine guidance on process validation, prompting sponsors to repeat studies to meet evolving sterility benchmarks, thereby sustaining membrane consumption. The upshot is a durable baseline of recurring orders that helps the laboratory filtration market weather macroeconomic swings.
Expansion of Cell & Gene Therapy Manufacturing
Approved cell- and gene-therapy products climbed to 37 by end-2025, and 180 programs advanced to Phase II/III, doubling the installed base of GMP suites dedicated to viral-vector work. Lentiviral and AAV purification depend on tangential-flow filtration, with each 50-L bioreactor run consuming around 12 m2 of hollow-fiber membrane. Sartorius reported that cell-therapy customers rose from 11% to 19% of its bioprocess revenue between 2023 and 2025, underlining how the segment reshapes order books. Commercial-scale expansion will require a tenfold increase in filtration capacity by 2028, compelling CDMOs to pre-qualify multiple suppliers. Vendors able to furnish viral-retention data across diverse serotypes enjoy a widening moat in the laboratory filtration market.
Supply-Chain Volatility for High-Grade Membrane Polymers
Polyvinylidene fluoride and polyethersulfone resins originate from just three Asian producers, so any disruption cascades through lead times of 8 to 12 weeks for finished rolls. A typhoon shut down a Taiwan PVDF plant in August 2025, reducing availability by 18% and driving up spot prices for pharmaceutical-grade PES by 23%. Large vendors hedge with multi-year offtake contracts, but mid-tier assemblers endure allocation cuts that erode margins. Regulatory dossiers name specific membrane chemistries, making emergency substitutions costly. Vertical integration, such as Sartorius' 2024 acquisition of a PES compounder, partially insulates top players; however, supply shocks remain a structural headwind for the laboratory filtration market.
Other drivers and restraints analyzed in the detailed report include:
- Rapid Adoption of Single-Use Filtration Assemblies
- Miniaturized High-Throughput Screening Driving Microfiltration Demand
- Waste-Disposal Compliance Costs for Single-Use Plastics
For complete list of drivers and restraints, kindly check the Table Of Contents.
Segment Analysis
Filtration Media captured 57.31% of revenue in 2025, underscoring the centrality of membrane rolls, pleated cartridges, and capsule filters to every stage of bioprocessing. Commoditization of 0.22-µm discs compresses margins, so suppliers differentiate through hydrophilic coatings and charged layers that command 20% premiums. Filtration Accessories, though smaller in value, are forecast to expand at a 10.92% CAGR to 2031 as laboratories automate liquid handling. A single screening robot can process 10,000 syringe filters per day, making accessories the fastest-growing segment of the laboratory filtration market.
Media stays on top because each biologics batch consumes square meters of membrane, but accessories now drive incremental profit. Bundling precision filters with pipetting decks locks in aftermarket revenue and discourages third-party alternatives. Filtration Assemblies, which include plug-and-play capsules and tangential-flow skids, sit between the two extremes, winning favor at CDMOs that prioritize rapid tech transfer over bespoke engineering. The laboratory filtration market size for assemblies is poised to increase in line with the uptake of single-use products; however, its growth rate lags behind the accessory boom due to longer unit replacement cycles.
Complete Report Scope:
- By Product Type
- Filtration Media
- Filtration Assemblies
- Filtration Accessories
- By Technique
- Microfiltration
- Ultrafiltration
- Nanofiltration & Reverse Osmosis
- Vacuum / Depth Filtration
- Others
- By End User
- Pharmaceutical & Biotechnology Companies
- Academic & Research Institutes
- Food & Beverage Testing Laboratories
- Environmental Testing Laboratories
- Others
- By Geography
- North America
- United States
- Canada
- Mexico
- Europe
- Germany
- United Kingdom
- France
- Italy
- Spain
- Rest of Europe
- Asia-Pacific
- China
- Japan
- India
- Australia
- South Korea
- Rest of Asia-Pacific
- Middle East & Africa
- GCC
- South Africa
- Rest of Middle East & Africa
- South America
- Brazil
- Argentina
- Rest of South America
- North America
Geography Analysis
North America held 36.24% revenue in 2025, backed by more than 1,200 GMP suites and the world's densest cluster of cell-therapy developers. U.S. CDMOs trial next-generation membranes first, so suppliers channel pilot lots to local customers, reinforcing the region's status as an early adopter. Canada's vaccine initiative funnels grants into single-use, ready-to-pilot plants, expanding the pull of accessories.
The Asia-Pacific region is the growth engine, with an 11.63% CAGR projected through 2031. China licensed 47 biosimilar plants in 2024, and India approved 29 biologics facilities in 2025 that standardized on disposable trains to satisfy U.S. FDA export norms. Samsung Biologics and WuXi Biologics added over 400,000 L of capacity, selecting partners who can deliver within 48 hours. Japan retrofits stainless steel lines with hybrid single-use modules to reduce cleaning and validation downtime, spurring demand for capsule filters.
Europe expands steadily, driven by EMA guidance on continuous manufacturing, which heightens the need for inline filtration. Germany and Switzerland are pivoting to autologous CAR-T platforms, so each patient lot requires dedicated filters, which lifts per-lot spend by up to 50%. The United Kingdom's post-Brexit convergence with EU standards eases supplier compliance. The Middle East & Africa are smaller today, yet Gulf states pledged USD 1 billion in 2025 for local biopharma, importing filtration assemblies until regional conversion plants emerge. South America's Brazil and Argentina push vaccine self-reliance; Fiocruz opened a 50,000-L complex in 2025 fitted with tangential-flow disposables. Across all regions, greenfield facilities leapfrog to single-use, accelerating the adoption of premium capsules and assemblies in the laboratory filtration market.
- 3M
- Agilent Technologies
- Avantor Inc. (VWR)
- Clarcor Industrial Air
- Cobetter Filtration Group
- Cole-Parmer (Antylia Scientific)
- Corning
- Danaher Corp. (Cytiva & Pall)
- Donaldson Company Inc.
- Eaton
- GVS
- Membrane Solutions LLC
- Merck KGaA (MilliporeSigma)
- Parker Hannifin
- Porvair plc
- Repligen
- Sartorius
- Sterlitech
- Thermo Fisher Scientific
Additional Benefits:
- The market estimate (ME) sheet in Excel format
- 3 months of analyst support
TABLE OF CONTENTS
1 Introduction
- 1.1 Study Assumptions & Market Definition
- 1.2 Scope of the Study
2 Research Methodology
3 Executive Summary
4 Market Landscape
- 4.1 Market Overview
- 4.2 Market Drivers
- 4.2.1 Accelerating Biopharma R&D Spend
- 4.2.2 Expansion of Cell & Gene Therapy Manufacturing
- 4.2.3 Rapid Adoption of Single-Use Filtration Assemblies
- 4.2.4 Miniaturized High-Throughput Screening Driving Microfiltration Demand
- 4.2.5 Growth of CROs & CDMOs Boosting Cost-Effective Filtration Assemblies
- 4.2.6 Technological Advancements in Laboratory Filtration
- 4.3 Market Restraints
- 4.3.1 Supply-Chain Volatility for High-Grade Membrane Polymers
- 4.3.2 Waste-Disposal Compliance Costs for Single-Use Plastics
- 4.3.3 Price Pressure from Commoditization of Syringe Filters
- 4.3.4 Emerging PFAS Regulations Limiting PTFE Filter Use
- 4.4 Value / Supply-Chain Analysis
- 4.5 Regulatory Landscape
- 4.6 Technological Outlook
- 4.7 Porter's Five Forces Analysis
- 4.7.1 Threat of New Entrants
- 4.7.2 Bargaining Power of Buyers
- 4.7.3 Bargaining Power of Suppliers
- 4.7.4 Threat of Substitutes
- 4.7.5 Competitive Rivalry
5 Market Size & Growth Forecasts
- 5.1 By Product Type
- 5.1.1 Filtration Media
- 5.1.2 Filtration Assemblies
- 5.1.3 Filtration Accessories
- 5.2 By Technique
- 5.2.1 Microfiltration
- 5.2.2 Ultrafiltration
- 5.2.3 Nanofiltration & Reverse Osmosis
- 5.2.4 Vacuum / Depth Filtration
- 5.2.5 Others
- 5.3 By End User
- 5.3.1 Pharmaceutical & Biotechnology Companies
- 5.3.2 Academic & Research Institutes
- 5.3.3 Food & Beverage Testing Laboratories
- 5.3.4 Environmental Testing Laboratories
- 5.3.5 Others
- 5.4 By Geography
- 5.4.1 North America
- 5.4.1.1 United States
- 5.4.1.2 Canada
- 5.4.1.3 Mexico
- 5.4.2 Europe
- 5.4.2.1 Germany
- 5.4.2.2 United Kingdom
- 5.4.2.3 France
- 5.4.2.4 Italy
- 5.4.2.5 Spain
- 5.4.2.6 Rest of Europe
- 5.4.3 Asia-Pacific
- 5.4.3.1 China
- 5.4.3.2 Japan
- 5.4.3.3 India
- 5.4.3.4 Australia
- 5.4.3.5 South Korea
- 5.4.3.6 Rest of Asia-Pacific
- 5.4.4 Middle East & Africa
- 5.4.4.1 GCC
- 5.4.4.2 South Africa
- 5.4.4.3 Rest of Middle East & Africa
- 5.4.5 South America
- 5.4.5.1 Brazil
- 5.4.5.2 Argentina
- 5.4.5.3 Rest of South America
- 5.4.1 North America
6 Competitive Landscape
- 6.1 Market Concentration
- 6.2 Market Share Analysis
- 6.3 Company Profiles (includes Global level Overview, Market-level Overview, Core Segments, Financials, Strategic Information, Market Rank/Share, Products & Services, Recent Developments)
- 6.3.1 3M
- 6.3.2 Agilent Technologies Inc.
- 6.3.3 Avantor Inc. (VWR)
- 6.3.4 Clarcor Industrial Air
- 6.3.5 Cobetter Filtration Group
- 6.3.6 Cole-Parmer (Antylia Scientific)
- 6.3.7 Corning Inc.
- 6.3.8 Danaher Corp. (Cytiva & Pall)
- 6.3.9 Donaldson Company Inc.
- 6.3.10 Eaton Corporation
- 6.3.11 GVS S.p.A
- 6.3.12 Membrane Solutions LLC
- 6.3.13 Merck KGaA (MilliporeSigma)
- 6.3.14 Parker Hannifin Corp.
- 6.3.15 Porvair plc
- 6.3.16 Repligen Corporation
- 6.3.17 Sartorius AG
- 6.3.18 Sterlitech Corporation
- 6.3.19 Thermo Fisher Scientific Inc.
7 Market Opportunities & Future Outlook
- 7.1 White-space & Unmet-need Assessment

