PUBLISHER: Mordor Intelligence | PRODUCT CODE: 2122720

PUBLISHER: Mordor Intelligence | PRODUCT CODE: 2122720
Dental Implants - Market Share Analysis, Industry Trends & Statistics, Growth Forecasts (2026 - 2031)
According to Mordor Intelligence, the dental implants market size is expected to grow from USD 5.33 billion in 2025 to USD 5.75 billion in 2026 and is forecast to reach USD 8.37 billion by 2031 at 7.81% CAGR over 2026-2031.
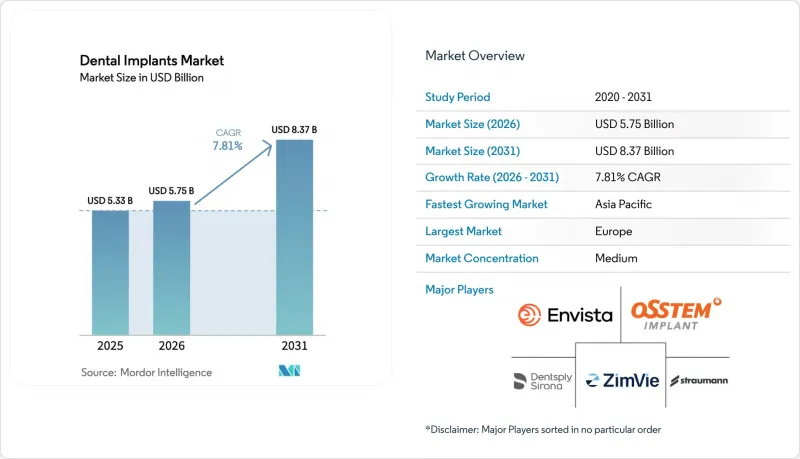
This report is Segmented by Component (Fixture [Endosteal Implants, and More] and Abutment), Material (Titanium Implants and Zirconium Implants), Design (Tapered Implants and Parallel-Walled Implants), Procedure Type (Immediate-Load Implant and Conventional), End User (Dental Hospitals & Clinics, and More), Geography (North America, Europe, and More). The Market Forecasts are Provided in Terms of Value (USD).
Global Dental Implants Market Trends and Insights
Aging-Driven Edentulism and Higher Disposable Incomes
Severe tooth loss affects 349 million individuals aged 60+ worldwide, and the absolute number is rising as longevity increases in almost every region. While preventive dentistry has preserved more natural dentition in high-income countries, demographic momentum means the total base of edentulous seniors is still expanding. Simultaneously, China's real disposable income grew 6.3% in 2024, and India's IMF-tracked per-capita GDP crossed USD 2,500, both developments that elevate affordability for multi-unit restorations. Reimbursement reforms in Germany and France now cover 60% of implant costs for full-arch cases, cutting patient co-pays and accelerating adoption. South Korea's extension of implant benefits to seniors drove a 34% procedure surge in 2024. The combined effect is a sustained demand driver that is relatively insulated from economic fluctuations because tooth replacement restores basic mastication and speech, not merely cosmetic appeal.
Growing Adoption of Digital Dentistry Workflows (CAD/CAM, 3-D Printing)
Digital workflows compress the implant cycle from diagnosis to definitive restoration by enabling accurate virtual planning and same-day prosthetics. Intraoral scanners replace conventional impressions, reducing cross-contamination risk and cutting remakes, while CAD software automates abutment design and surgical-guide fabrication in minutes. Dentsply Sirona reported a 23% jump in digital equipment sales during fiscal 2024, attributing most growth to implant-focused users. Updated FDA guidance published in October 2024 clarified sterility validation for 3-D-printed dental devices, streamlining approvals. General dentists can therefore adopt implants without outsourcing planning, expanding the dental implants market to primary care settings. Compliance with ISO 13485 and ISO 20795-1 is now a baseline, ensuring traceability across digital production. As more DSOs adopt centralized milling and printing, economies of scale drive down unit costs, further boosting penetration.
High Procedure Cost and Limited Insurance Outside OECD
Single-unit restorations cost USD 1,500 in India and USD 4,500 in the United States, with full-arch therapies exceeding annual household incomes in Brazil, Argentina, and Nigeria. Insurance penetration for dental services remains below 15% in Latin America and sub-Saharan Africa, and most plans classify implants as cosmetic. Financing schemes offered by DSO networks and private lenders carry interest rates above 20%, deterring uptake among price-sensitive patients. Import tariffs on titanium and zirconium raise landed costs 10-15% in protective markets such as Argentina and South Africa. Affordability thus caps the dental implants market in demographically favorable yet low-income geographies.
Other drivers and restraints analyzed in the detailed report include:
- Expansion of National Implant-Reimbursement Schemes
- Consolidation of Dental Service Organizations (DSOs) Enabling Bulk Procurement
- Shortage of Trained Implantologists in Tier-2 and Tier-3 Cities
For complete list of drivers and restraints, kindly check the Table Of Contents.
Segment Analysis
Fixtures dominated 75.55% of the dental implants market in 2025, underscoring their essential role as osseointegrating anchors, but abutments are projected to outpace overall growth at a 9.25% CAGR through 2031 as centralized milling drives mass customization. The dental implants market size allocated to abutments is expanding because labs now produce patient-specific milled components in hours, reducing reliance on stock parts and allowing screw-retained designs that minimize cement-related peri-implantitis. Endosteal fixtures remain the default choice, while sub-periosteal constructs stay niche. Stock abutment share keeps falling as CAD/CAM processes reach price parity and deliver superior emergence profiles.
Digital labs leverage five-axis mills and selective-laser-melting printers to batch abutment runs, achieving tolerances within +-10 µm while cutting per-unit cost by 30%. Straumann's Variobase line illustrates ecosystem stickiness because compatible platforms encourage repeat purchases of matching analogs, screws, and prosthetic components. ISO 14801 fatigue testing and ISO 10993 biocompatibility remain gating standards, yet high-volume labs routinely exceed them, underscoring industrial-grade quality control. As DSOs dictate procurement, suppliers that bundle implant, abutment, and digital workflows win contracts, reinforcing vertical integration.
Titanium continued to command 85.53% share in 2025, reflecting its robust osseointegration profile and cost efficiency, while zirconium implants, though smaller, are forecast to grow at a 10.85% CAGR through 2031. The dental implants market increasingly segments by gingival biotype; thin tissues reveal titanium's gray hue, but zirconium's light color avoids esthetic show-through. In three-year data, Straumann PURE ceramic implants posted a 96.7% survival rate, closing historical performance gaps with metal fixtures.
Manufacturing hurdles persist because zirconium requires hot-isostatic pressing and exacting machining, which raise unit cost 40-60% above titanium. Yet price sensitivity is less pronounced in maxillary anterior indications, where patient willingness to pay for esthetics is high. ASTM F2393 and ISO 13356 standards guarantee phase-stability and mechanical strength, and advances in yttria-stabilized formulations reduce brittleness. If zirconium feedstock pricing moderates and printing techniques mature, adoption will broaden into short-span bridges and select posterior cases.
Complete Report Scope:
- By Component
- Fixture
- Endosteal Implants
- Sub-periosteal Implants
- Trans-osteal Implants
- Intra-mucosal Implants
- Abutment
- Fixture
- By Material
- Titanium Implants
- Zirconium Implants
- By Design
- Tapered Implants
- Parallel-Walled Implants
- By Procedure Type
- Immediate-Load Procedure
- Conventional Procedure
- By End User
- Dental Hospitals & Clinics
- Dental Laboratories
- Academic & Research Institutes
- Geography
- North America
- United States
- Canada
- Mexico
- Europe
- Germany
- United Kingdom
- France
- Italy
- Spain
- Rest of Europe
- Asia-Pacific
- China
- Japan
- India
- Australia
- South Korea
- Rest of Asia-Pacific
- Middle East & Africa
- GCC
- South Africa
- Rest of Middle East & Africa
- South America
- Brazil
- Argentina
- Rest of South America
- North America
Geography Analysis
Europe retained 35.13% of the dental implants market in 2025 as reimbursement in Germany and France expanded coverage, yet growth is plateauing because urban penetration approaches maturity. Germany's 2024 statutory reforms enlarged eligibility, but most incremental cases involve elderly patients with comorbidities, complicating surgery. France's fragmented practice ownership slows DSO penetration, preserving loyalty to premium brands but limiting volume discounts. Spain benefits from dental tourism by U.K. residents who seek lower priced implants, cushioning demand despite domestic wage stagnation. The United Kingdom, where NHS omits implant coverage, remains heavily private-pay, restricting uptake mainly to affluent cohorts; currency fluctuations post-Brexit have further inflated import costs. EU MDR compliance costs have nudged smaller suppliers toward mergers or pull-out, subtly tightening competitive breadth.
Asia-Pacific is growing at a 9.91% CAGR and will surpass Europe late in the forecast. China's market is pivoting from import dependence to local production, with Hangzhou Jiace and Zhuhai Livzon undercutting European imports by as much as 50%. Domestic share rose sharply after Beijing's "Made in China 2025" priority designation for advanced medical devices granted tax incentives and accelerated NMPA reviews. India adds roughly 550,000 new implant units yearly, propelled by medical tourists and the rise of multi-city groups such as Clove Dental, which standardize protocols and leverage digital marketing. Japan is largely saturated but maintains premium pricing due to stringent Shonin approval and cultural preference for domestic brands like GC. South Korea's insurance subsidy for seniors triggered a 34% procedure spike in 2024, and local giants Osstem and Dentium added capacity that now exceeds 12 million units annually. Australia's TGA streamlined approvals in 2024, expediting novel coatings and designs, while Thailand and Malaysia serve regional medical tourists seeking 60-70% discounts compared with Western clinics.
North America remains the highest value per-unit region, with average surgical and prosthetic fees topping USD 4,500. Aggressive DSO expansion is transforming procurement; Heartland Dental, Aspen Dental, and Pacific Dental operate labs that collectively produce more than 120,000 implant restorations per year, pressuring margins for manufacturers unable to furnish integrated scanners and CAD/CAM mills. The FDA's renewed emphasis on real-world evidence and post-market surveillance raises documentation costs but also erects barriers against low-service entrants, defending incumbent positions. Canada maintains a private-pay structure, and rising cross-border traffic to Mexican border towns underscores persistent affordability gaps. South America continues to lag because of currency volatility and low insurance coverage; Brazil's real depreciation raised implant imports by 18% in local terms, dampening demand. Middle East & Africa remains emergent; GCC countries invest in dental tourism complexes, but penetration is low outside urban hubs and tariff regimes inflate titanium and zirconium costs.
- AlphaBio Tec.
- BEGO GmbH & Co. KG
- BioHorizons IPH Inc.
- Blue Sky Bio LLC
- Cortex Dental Implants Industries Ltd.
- Dentium Co., Ltd.
- Dentsply Sirona
- DIO
- Envista Holdings (Nobel Biocare)
- GC Corporation
- Straumann Group
- Kyocera Medical Corporation
- MegaGen Implant Co., Ltd.
- Osstem Implant Co., Ltd.
- Thommen Medical
- ZimVie
Additional Benefits:
- The market estimate (ME) sheet in Excel format
- 3 months of analyst support
TABLE OF CONTENTS
1 Introduction
- 1.1 Study Assumptions & Market Definition
- 1.2 Scope of the Study
2 Research Methodology
3 Executive Summary
4 Market Landscape
- 4.1 Market Overview
- 4.2 Market Drivers
- 4.2.1 Aging-driven edentulism and higher disposable incomes
- 4.2.2 Growing adoption of digital dentistry workflows (CAD/CAM, 3-D printing)
- 4.2.3 Expansion of national implant-reimbursement schemes
- 4.2.4 Consolidation of Dental Service Organisations enabling bulk procurement
- 4.2.5 AI-guided surgical planning cutting failure rates & chair-time
- 4.2.6 Sustainability mandates accelerating shift to recyclable & bio-sourced packaging
- 4.3 Market Restraints
- 4.3.1 High procedure cost & limited insurance outside OECD
- 4.3.2 Shortage of trained implantologists in tier-2/3 cities
- 4.3.3 Looming titanium supply constraints from aerospace super-cycle
- 4.3.4 Cyber-risk exposure of cloud-based implant workflow platforms
- 4.4 Value / Supply-Chain Analysis
- 4.5 Regulatory Landscape
- 4.6 Technological Outlook
- 4.7 Porter's Five Forces
- 4.7.1 Threat of New Entrants
- 4.7.2 Bargaining Power of Buyers
- 4.7.3 Bargaining Power of Suppliers
- 4.7.4 Threat of Substitutes
- 4.7.5 Competitive Rivalry
5 Market Size & Growth Forecasts (Value, USD)
- 5.1 By Component
- 5.1.1 Fixture
- 5.1.1.1 Endosteal Implants
- 5.1.1.2 Sub-periosteal Implants
- 5.1.1.3 Trans-osteal Implants
- 5.1.1.4 Intra-mucosal Implants
- 5.1.2 Abutment
- 5.1.1 Fixture
- 5.2 By Material
- 5.2.1 Titanium Implants
- 5.2.2 Zirconium Implants
- 5.3 By Design
- 5.3.1 Tapered Implants
- 5.3.2 Parallel-Walled Implants
- 5.4 By Procedure Type
- 5.4.1 Immediate-Load Procedure
- 5.4.2 Conventional Procedure
- 5.5 By End User
- 5.5.1 Dental Hospitals & Clinics
- 5.5.2 Dental Laboratories
- 5.5.3 Academic & Research Institutes
- 5.6 Geography
- 5.6.1 North America
- 5.6.1.1 United States
- 5.6.1.2 Canada
- 5.6.1.3 Mexico
- 5.6.2 Europe
- 5.6.2.1 Germany
- 5.6.2.2 United Kingdom
- 5.6.2.3 France
- 5.6.2.4 Italy
- 5.6.2.5 Spain
- 5.6.2.6 Rest of Europe
- 5.6.3 Asia-Pacific
- 5.6.3.1 China
- 5.6.3.2 Japan
- 5.6.3.3 India
- 5.6.3.4 Australia
- 5.6.3.5 South Korea
- 5.6.3.6 Rest of Asia-Pacific
- 5.6.4 Middle East & Africa
- 5.6.4.1 GCC
- 5.6.4.2 South Africa
- 5.6.4.3 Rest of Middle East & Africa
- 5.6.5 South America
- 5.6.5.1 Brazil
- 5.6.5.2 Argentina
- 5.6.5.3 Rest of South America
- 5.6.1 North America
6 Competitive Landscape
- 6.1 Market Concentration
- 6.2 Market Share Analysis
- 6.3 Company Profiles (includes Global level Overview, Market level Overview, Core Segments, Financials as available, Strategic Information, Market Rank/Share for key companies, Products & Services, and Recent Developments)
- 6.3.1 AlphaBio Tec.
- 6.3.2 BEGO GmbH & Co. KG
- 6.3.3 BioHorizons IPH Inc.
- 6.3.4 Blue Sky Bio LLC
- 6.3.5 Cortex Dental Implants Industries Ltd.
- 6.3.6 Dentium Co., Ltd.
- 6.3.7 Dentsply Sirona Inc.
- 6.3.8 DIO Corporation
- 6.3.9 Envista Holdings (Nobel Biocare)
- 6.3.10 GC Corporation
- 6.3.11 Institut Straumann AG
- 6.3.12 Kyocera Medical Corporation
- 6.3.13 MegaGen Implant Co., Ltd.
- 6.3.14 Osstem Implant Co., Ltd.
- 6.3.15 Thommen Medical AG
- 6.3.16 ZimVie Inc.
7 Market Opportunities & Future Outlook
- 7.1 White-space & Unmet-Need Assessment

