PUBLISHER: Mordor Intelligence | PRODUCT CODE: 2123061

PUBLISHER: Mordor Intelligence | PRODUCT CODE: 2123061
Data Quality Tools - Market Share Analysis, Industry Trends & Statistics, Growth Forecasts (2026 - 2031)
According to Mordor Intelligence, the data quality tools market size is expected to grow from USD 2.78 billion in 2025 to USD 3.27 billion in 2026 and is forecast to reach USD 7.39 billion by 2031 at 17.7% CAGR over 2026-2031.
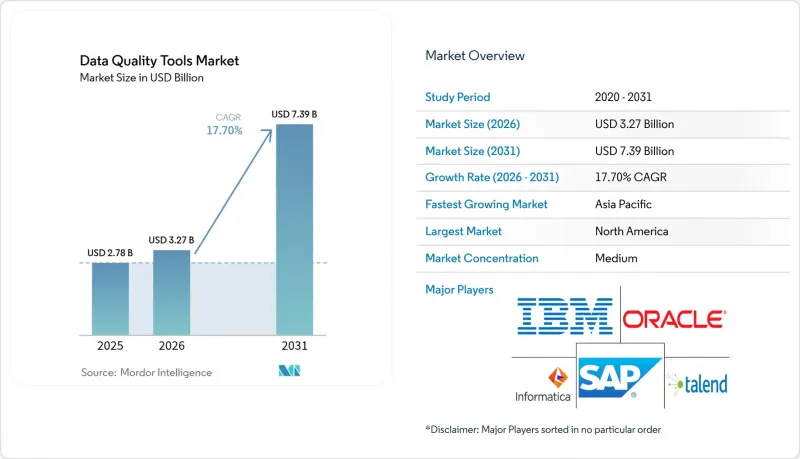
This report is Segmented by Deployment Type (Cloud-Based, On-Premise), Size of the Organization (SMEs, Large Enterprises), Component (Software, Services), Data Domain (Customer Data, Product Data, and More), Tool Type (Data Profiling, Data Cleansing/Standardisation, and More), End-User Vertical (BFSI, Government and Public Sector, and More), Geography. The Market Forecasts are Provided in Terms of Value (USD).
Global Data Quality Tools Market Trends and Insights
Accelerated Migration of Core Banking Platforms to Cloud Driving High-Volume Data Remediation Projects
Financial institutions moving legacy cores to cloud environments are prioritizing automated data remediation to keep lending and payments processes online. Mortgage approval checks that once took 4-6 hours under manual validation now run in near real time after tool deployment, improving customer experience and reducing operational risk. Cloud-native data quality engines tighten feedback loops between data ingestion, profiling and AI-driven analytics, creating a cycle in which better data increases cloud ROI, which in turn reinforces quality budgets.
Intensifying ESG-Reporting Mandates Necessitating Enterprise-Wide Data Quality Controls
SEC climate disclosures, California SB-253/SB-261, and the EU CSRD begin in January 2025 and collectively affect thousands of firms. Compliance programmes now earmark dedicated budgets for lineage, validation, and audit-readiness functionality. Boards link poor ESG data to reputational risk, pushing sustainability officers to adopt solutions that track Scope 3 emissions and verify supplier declarations .
Persistent Technical Debt in Legacy On-Prem Data Warehouses Delaying Modern Tool Adoption
Many organisations divert budgets to maintain ageing ETL jobs and proprietary databases, spending USD 3 million yearly on upkeep. Integration gaps between old schemas and modern APIs slow rollouts, leading firms in finance and healthcare to phase upgrades over multi-year roadmaps before unlocking full cloud-native quality capabilities.
Other drivers and restraints analyzed in the detailed report include:
- AI-Driven Customer 360 Initiatives Boosting Spend on Data Profiling & Matching Tools
- Real-Time Fraud-Detection Pipelines in BFSI Catalysing Demand for Streaming Data Quality Engines
- Shortage of Data Engineering Talent Limiting Effective Tool Utilisation in SMEs
For complete list of drivers and restraints, kindly check the Table Of Contents.
Segment Analysis
Cloud deployments generated 63.45% of data quality tools market revenue in 2025, equal to roughly USD 1.76 billion in the 2025 baseline year. Exceptional 19.8% CAGR indicates that scalability, elastic pricing, and proximity to cloud data stores outweigh security concerns for most buyers. The data quality tools market size for cloud services is set to expand rapidly as API-driven connectors simplify ingestion from SaaS sources and streaming platforms.
On-premise installations remain critical for sectors handling sensitive patient, payment, or defence data. Accounting for 36.55% of revenue in 2025, this cohort is enhancing hybrid capabilities that bridge regulated workloads with public cloud analytics. Healthcare providers illustrate the balance, retaining clinical records on site while cleansing lab feeds in HIPAA-compliant clouds.
Large enterprises produced 57.30% of total revenue in 2025, thanks to complex data estates spanning dozens of domains and regulatory mandates. Many run enterprise governance programmes that integrate data profiling, monitoring, and remediation into common control planes. The data quality tools market size among large enterprises is stable yet incremental.
SMEs deliver the strongest momentum with 18.9% CAGR to 2031. Pay-as-you-go pricing, consumption credits, and modular packaging lower entry costs. Case studies from UK manufacturers show that improved data quality increased product innovation velocity and enhanced competitive positioning, fostering broader adoption beyond early tech adopters.
Complete Report Scope:
- By Deployment Type
- Cloud-based
- On-Premise
- By Size of the Organization
- Small and Medium Enterprises
- Large Enterprises
- By Component
- Software
- Services
- By Data Domain
- Customer Data
- Product Data
- Financial Data
- Supplier and Vendor Data
- Risk and Compliance Data
- By Tool Type
- Data Profiling
- Data Cleansing / Standardisation
- Data Matching and De-Duplication
- Monitoring and Alerting
- Master Data Management-Centric Tools
- By End-User Vertical
- BFSI
- Government and Public Sector
- IT and Telecom
- Retail and E-commerce
- Healthcare and Life Sciences
- Other Industries (Manufacturing, Utilities, Media)
- By Geography
- North America
- United States
- Canada
- Mexico
- South America
- Brazil
- Argentina
- Chile
- Peru
- Rest of South America
- Europe
- Germany
- United Kingdom
- France
- Italy
- Spain
- Rest of Europe
- Asia-Pacific
- China
- Japan
- South Korea
- India
- Australia
- New Zealand
- Rest of Asia-Pacific
- Middle East and Africa
- United Arab Emirates
- Saudi Arabia
- Turkey
- South Africa
- Rest of Middle East and Africa
- North America
Geography Analysis
North America generated 35.70% of global revenue in 2025, or close to USD 0.99 billion in 2025, underpinned by heavy cloud migration in financial services and advanced adoption of AI-enabled analytics. The introduction of SEC climate reporting rules strengthens the compliance rationale for enterprise-wide data controls. Vendors headquartered in the region accelerate innovation cycles, providing early exposure to new features.
Asia-Pacific is the fastest mover with a projected 21.7% CAGR from 2026 to 2031. Investments in 5G, e-commerce, and fintech generate vast data volumes that require quality assurances. China, India, and Japan emphasise data integrity as a pillar of digital public infrastructure, while APAC retailers deploy profiling engines to enhance Customer 360 rollouts and personalise offers.
Europe's growth is steady, driven by stringent privacy and sustainability mandates. The CSRD drives demand for solutions that ensure auditable ESG disclosures. Organisations weigh cloud benefits against data sovereignty, adopting regional nodes or sovereign clouds to comply with localisation rules. Increasingly, European boards recognise clean data as foundational to digital competitiveness.
- Informatica Inc.
- IBM Corporation
- SAP SE
- Oracle Corporation
- SAS Institute Inc.
- Precisely (Syncsort)
- Talend Inc.
- Experian PLC
- Ataccama Corp.
- Microsoft Corp.
- Collibra NV
- TIBCO Software Inc.
- Alteryx Inc.
- Dun and Bradstreet Holdings Inc.
- Moody's Analytics/Bureau van Dijk
- Information Builders (ibi/TIBCO)
- Data Ladder LLC
- Melissa Data Corp.
- Innovative Systems Inc.
- ASG Technologies
Additional Benefits:
- The market estimate (ME) sheet in Excel format
- 3 months of analyst support
TABLE OF CONTENTS
1 INTRODUCTION
- 1.1 Study Assumptions and Market Definition
- 1.2 Scope of the Study
2 RESEARCH METHODOLOGY
3 EXECUTIVE SUMMARY
4 MARKET LANDSCAPE
- 4.1 Market Overview
- 4.2 Market Drivers
- 4.2.1 Accelerated Migration of Core Banking Platforms to Cloud Driving High-Volume Data Remediation Projects in North America
- 4.2.2 Intensifying ESG-Reporting Mandates in Europe Necessitating Enterprise-Wide Data Quality Controls
- 4.2.3 AI-Driven Customer 360 Initiatives Boosting Spend on Data Profiling and Matching Tools Across APAC Retail
- 4.2.4 Vendor-Native Automation Plug-Ins Reducing Total Cost-of-Ownership for SaaS Workloads
- 4.2.5 Real-Time Fraud-Detection Pipelines in BFSI Catalysing Demand for Streaming Data Quality Engines
- 4.2.6 Healthcare Interoperability Rules (US and EU) Accelerating FHIR-Compatible Data Cleansing Solutions
- 4.3 Market Restraints
- 4.3.1 Persistent Technical Debt in Legacy On-Prem Data Warehouses Delaying Modern Tool Adoption
- 4.3.2 Fragmented Regional Data-Residency Statutes Complicating Global Roll-Outs
- 4.3.3 Shortage of Data Engineering Talent Limiting Effective Tool Utilisation in SMEs
- 4.3.4 High Switching Costs from Embedded ETL Rule-Sets within Tier-1 ERP Suites
- 4.4 Technological Outlook
- 4.5 Porter's Five Forces Analysis
- 4.5.1 Bargaining Power of Suppliers
- 4.5.2 Bargaining Power of Consumers
- 4.5.3 Threat of New Entrants
- 4.5.4 Threat of Substitute Products
- 4.5.5 Intensity of Competitive Rivalry
- 4.6 Assessment of Macroeconomic Factors Impact on the Market
5 MARKET SIZE AND GROWTH FORECASTS (VALUE)
- 5.1 By Deployment Type
- 5.1.1 Cloud-based
- 5.1.2 On-Premise
- 5.2 By Size of the Organization
- 5.2.1 Small and Medium Enterprises
- 5.2.2 Large Enterprises
- 5.3 By Component
- 5.3.1 Software
- 5.3.2 Services
- 5.4 By Data Domain
- 5.4.1 Customer Data
- 5.4.2 Product Data
- 5.4.3 Financial Data
- 5.4.4 Supplier and Vendor Data
- 5.4.5 Risk and Compliance Data
- 5.5 By Tool Type
- 5.5.1 Data Profiling
- 5.5.2 Data Cleansing / Standardisation
- 5.5.3 Data Matching and De-Duplication
- 5.5.4 Monitoring and Alerting
- 5.5.5 Master Data Management-Centric Tools
- 5.6 By End-User Vertical
- 5.6.1 BFSI
- 5.6.2 Government and Public Sector
- 5.6.3 IT and Telecom
- 5.6.4 Retail and E-commerce
- 5.6.5 Healthcare and Life Sciences
- 5.6.6 Other Industries (Manufacturing, Utilities, Media)
- 5.7 By Geography
- 5.7.1 North America
- 5.7.1.1 United States
- 5.7.1.2 Canada
- 5.7.1.3 Mexico
- 5.7.2 South America
- 5.7.2.1 Brazil
- 5.7.2.2 Argentina
- 5.7.2.3 Chile
- 5.7.2.4 Peru
- 5.7.2.5 Rest of South America
- 5.7.3 Europe
- 5.7.3.1 Germany
- 5.7.3.2 United Kingdom
- 5.7.3.3 France
- 5.7.3.4 Italy
- 5.7.3.5 Spain
- 5.7.3.6 Rest of Europe
- 5.7.4 Asia-Pacific
- 5.7.4.1 China
- 5.7.4.2 Japan
- 5.7.4.3 South Korea
- 5.7.4.4 India
- 5.7.4.5 Australia
- 5.7.4.6 New Zealand
- 5.7.4.7 Rest of Asia-Pacific
- 5.7.5 Middle East and Africa
- 5.7.5.1 United Arab Emirates
- 5.7.5.2 Saudi Arabia
- 5.7.5.3 Turkey
- 5.7.5.4 South Africa
- 5.7.5.5 Rest of Middle East and Africa
- 5.7.1 North America
6 COMPETITIVE LANDSCAPE
- 6.1 Strategic Developments
- 6.2 Vendor Positioning Analysis
- 6.3 Company Profiles (includes Global level Overview, Market level overview, Core Segments, Financials as available, Strategic Information, Products and Services, and Recent Developments)
- 6.3.1 Informatica Inc.
- 6.3.2 IBM Corporation
- 6.3.3 SAP SE
- 6.3.4 Oracle Corporation
- 6.3.5 SAS Institute Inc.
- 6.3.6 Precisely (Syncsort)
- 6.3.7 Talend Inc.
- 6.3.8 Experian PLC
- 6.3.9 Ataccama Corp.
- 6.3.10 Microsoft Corp.
- 6.3.11 Collibra NV
- 6.3.12 TIBCO Software Inc.
- 6.3.13 Alteryx Inc.
- 6.3.14 Dun and Bradstreet Holdings Inc.
- 6.3.15 Moody's Analytics/Bureau van Dijk
- 6.3.16 Information Builders (ibi/TIBCO)
- 6.3.17 Data Ladder LLC
- 6.3.18 Melissa Data Corp.
- 6.3.19 Innovative Systems Inc.
- 6.3.20 ASG Technologies
7 MARKET OPPORTUNITIES AND FUTURE OUTLOOK
- 7.1 White-Space and Unmet-Need Assessment

