PUBLISHER: Mordor Intelligence | PRODUCT CODE: 2123063

PUBLISHER: Mordor Intelligence | PRODUCT CODE: 2123063
Security Orchestration - Market Share Analysis, Industry Trends & Statistics, Growth Forecasts (2026 - 2031)
According to Mordor Intelligence, the security orchestration market size was valued at USD 1.22 billion in 2025 and estimated to grow from USD 1.4 billion in 2026 to reach USD 2.81 billion by 2031, at a CAGR of 14.88% during the forecast period (2026-2031).
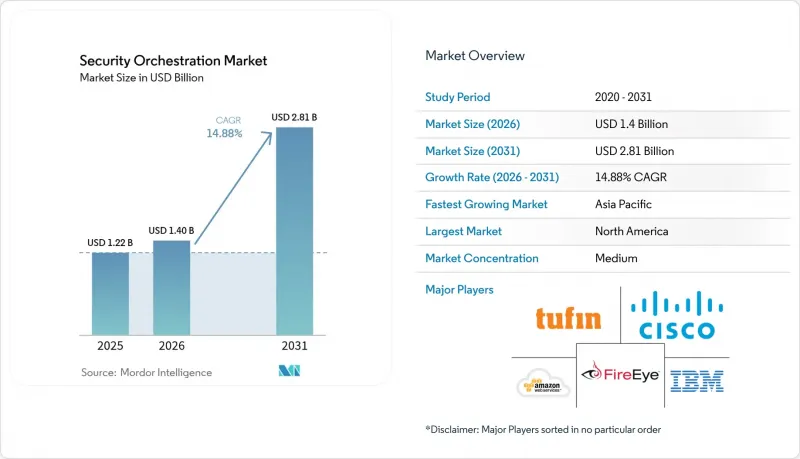
This report is Segmented by Type (Software/Platform, and Services), Deployment Mode (On-Premise, Cloud, and Hybrid), Organization Size (Large Enterprises, and Small and Medium Enterprises), End-User Industry (Banking, Financial Services and Insurance, Information Technology and Telecommunication, Government and Defense, and More), and Geography. The Market Forecasts are Provided in Terms of Value (USD).
Global Security Orchestration Market Trends and Insights
Rising Trend of Automated Security Operations
Security teams now replace manual ticket triage with machine-initiated containment steps that execute in seconds, compressing mean time to respond from nearly an hour to mere minutes. Ransomware that can encrypt systems within 45 minutes leaves no buffer for human signoff, making automated response a survival imperative. Playbooks also serve proactive hunting functions, launching scheduled queries across endpoint, network, and cloud logs when threat feeds highlight new indicators. Enterprises that postpone automation confront both slower defense and rapid analyst churn, given that alert volumes rose 30% year on year in 2024.
Need To Integrate Disparate Cybersecurity Technologies
Enterprises run roughly 45 security tools yet struggle to link more than one-fifth of them through robust two-way APIs. Orchestration solves the swivel-chair problem by normalizing alerts and enriching them in a single pane, an approach that becomes indispensable once organizations exceed 40 tools. Regulatory frameworks such as GDPR enforce rapid incident containment, making manual cross-tool correlation unworkable. The security orchestration market, therefore, scales in direct proportion to tool sprawl because ROI shifts from productivity to basic feasibility.
Lack Of Skilled Cybersecurity Personnel
ISC2 reported a 4.8-million-person shortfall in 2024, and orchestration projects stall when teams lack API and playbook engineering skills. Many deployments wind up automating little more than ticket creation because advanced steps network isolation or cloud instance suspension require logic design expertise. Skills gaps are acute in Asia Pacific, where 68% of Indian security leaders flagged talent scarcity as the primary barrier to adoption. Vendors now push low-code builders and managed services, but those fixes dilute customization and can leave organizations locked into vendor playbooks.
Other drivers and restraints analyzed in the detailed report include:
- Increasing Sophistication and Volume of Cyberattacks
- AI-Powered Adaptive Playbooks Accelerating Response
- High Initial Deployment and Integration Costs
For complete list of drivers and restraints, kindly check the Table Of Contents.
Segment Analysis
The security orchestration market size for software and platforms reached USD 749.7 million in 2025 and commanded 61.45% share. Services, however, are projected to widen at a 15.72% CAGR through 2031, signalling that integration and operational management drive value more than code ownership. Professional services concentrate on custom API bridges linking orchestration engines to specialty tools, an area where off-the-shelf connectors are still lacking. Managed services appeal to organizations that cannot expand headcount but still need 24-hour response coverage. Vendors therefore bundle licenses with outcome-based service tiers that guarantee target mean time to respond instead of selling pure software subscriptions. Pricing pressure on the software line has already surfaced, with consumption-based models letting buyers pay per playbook execution rather than commit to enterprise licenses.
As service uptake grows, strategic emphasis shifts to knowledge transfer and continuous tuning. Enterprises recognize that a static library of playbooks loses relevance within months, so they pay integrators to perform quarterly logic reviews and update connectors as vendor APIs evolve. These dynamic feeds a recurrent revenue stream that stabilizes vendor cash flow, even if new logo growth slows. It also raises competitive barriers, because incumbent integrators embed deeply in customer environments, making rip-and-replace decisions costly. For buyers, the calculus pivots from license discounts to provider expertise, driving consolidation among boutique systems integrators eager to scale globally.
On-premises deployments still make up 55.10% of the security orchestration market share, driven by data sovereignty rules in government, defense, and healthcare. Yet cloud platforms are expanding at 16.38% a year because they scale compute instantly during alert spikes and integrate natively with cloud-native security services. Vendors report that bookings tied to cloud subscriptions outstrip on-premises deals, reflecting preference for pay-as-you-go economics. Hybrid patterns have become the norm in regulated industries, which store sensitive case data on company servers while offloading compute-heavy malware analysis to vendor clouds. This architecture satisfies compliance, delivers elasticity, and allows gradual migration without rewriting playbooks.
Cloud adoption also aligns with DevSecOps, where development teams expect security tooling to run in the same Kubernetes clusters as application workloads. Orchestration delivered as a container service meets that expectation and avoids lengthy infrastructure procurement cycles. Meanwhile, major vendors embed threat intelligence directly into their cloud offerings, an advantage on-premises versions lack unless organizations acquire third-party feeds. As the regulatory climate clarifies, especially around personal data processing, experts anticipate a tipping point after which cloud consumption overtakes on-premises footprints, echoing the broader SaaS trend already visible in adjacent security categories.
Complete Report Scope:
- By Type
- Software/Platform
- Services
- Professional Services
- Managed Services
- By Deployment Mode
- On-Premises
- Cloud
- Hybrid
- By Organization Size
- Large Enterprises
- Small and Medium Enterprises
- By End-User Industry
- Banking, Financial Services and Insurance
- Information Technology and Telecommunication
- Government and Defense
- Healthcare and Life Sciences
- Retail and Ecommerce
- Energy and Utilities
- Other End-User Industries
- By Geography
- North America
- United States
- Canada
- Mexico
- South America
- Brazil
- Argentina
- Rest of South America
- Europe
- United Kingdom
- Germany
- France
- Russia
- Rest of Europe
- Asia Pacific
- China
- Japan
- India
- Australia
- South Korea
- Rest of Asia Pacific
- Middle East
- United Arab Emirates
- Saudi Arabia
- Turkey
- Rest of Middle East
- Africa
- South Africa
- Egypt
- Nigeria
- Rest of Africa
- North America
Geography Analysis
North America generated 38.10% of 2025 revenue thanks to early adopter enterprises, well-defined regulatory frameworks, and a dense vendor ecosystem. Federal directives, including CISA guidance encouraging SIEM-SOAR convergence, sustain procurement by critical infrastructure operators. Growth is decelerating from early-cycle highs as most Fortune 1000 organizations already run at least pilots. Focus now shifts to optimization engagements, where service providers fine-tune existing logic rather than sell new licenses.
Asia Pacific is set to lead growth at 15.52% CAGR through 2031, powered by accelerated digital transformation in India, Japan, Australia, and China. Monetary authorities such as the MAS in Singapore codify automated response expectations for financial institutions, effectively mandating SOAR adoption. The region's 2.6-million-person cybersecurity talent gap motivates automation as a compensatory strategy. Vendors succeed by pairing cloud delivery with local data-center options to respect residency rules, a model that attracts mid-tier banks and e-commerce platforms alike.
Europe occupies a nuanced middle ground. GDPR breach-notification requirements push enterprises toward orchestration capable of time-stamped evidence capture, but fragmented national regulations complicate cross-border playbooks. Hybrid deployments dominate, keeping sensitive data on local servers while using cloud compute for enrichment. Middle East programs in the United Arab Emirates and Saudi Arabia earmark public funds for automated security operations, creating lighthouse projects that lift regional visibility. Africa and South America remain nascent, with adoption concentrated in multinational subsidiaries and government agencies, yet cloud delivery plus managed services are lowering barriers quickly.
- International Business Machines Corporation
- Cisco Systems Inc.
- Palo Alto Networks Inc.
- Splunk Inc.
- Swimlane LLC
- FireEye Inc.
- DFLabs SpA
- Siemplify Ltd
- Tufin Software Technologies Ltd
- RSA Security LLC
- Fortinet Inc.
- Rapid7 Inc.
- LogRhythm Inc.
- Cyberbit Ltd
- Forescout Technologies Inc.
- ThreatConnect Inc.
- Securonix Inc.
- Exabeam Inc.
- Accenture PLC
- Amazon Web Services Inc.
Additional Benefits:
- The market estimate (ME) sheet in Excel format
- 3 months of analyst support
TABLE OF CONTENTS
1 INTRODUCTION
- 1.1 Scope of the Study
2 RESEARCH METHODOLOGY
3 EXECUTIVE SUMMARY
4 MARKET LANDSCAPE
- 4.1 Market Overview
- 4.2 Market Drivers
- 4.2.1 Rising Trend of Automated Security Operations
- 4.2.2 Need to Integrate Disparate Cybersecurity Technologies
- 4.2.3 Increasing Sophistication and Volume of Cyberattacks
- 4.2.4 Growing Adoption of Cloud-Based Security Architectures
- 4.2.5 Integration of SOAR Into DevSecOps Pipelines
- 4.2.6 AI-Powered Adaptive Playbooks Accelerating Response
- 4.3 Market Restraints
- 4.3.1 Lack of Skilled Cybersecurity Personnel
- 4.3.2 High Initial Deployment and Integration Costs
- 4.3.3 Low Interoperability of Proprietary Orchestration Standards
- 4.3.4 Regulatory Hesitation Toward Fully Automated Response
- 4.4 Industry Value-Chain Analysis
- 4.5 Regulatory Landscape
- 4.6 Technological Outlook
- 4.7 Porter's Five Forces Analysis
- 4.7.1 Threat of New Entrants
- 4.7.2 Bargaining Power of Buyers
- 4.7.3 Bargaining Power of Suppliers
- 4.7.4 Threat of Substitutes
- 4.7.5 Intensity of Competitive Rivalry
5 MARKET SIZE AND GROWTH FORECASTS (VALUE)
- 5.1 By Type
- 5.1.1 Software/Platform
- 5.1.2 Services
- 5.1.2.1 Professional Services
- 5.1.2.2 Managed Services
- 5.2 By Deployment Mode
- 5.2.1 On-Premises
- 5.2.2 Cloud
- 5.2.3 Hybrid
- 5.3 By Organization Size
- 5.3.1 Large Enterprises
- 5.3.2 Small and Medium Enterprises
- 5.4 By End-User Industry
- 5.4.1 Banking, Financial Services and Insurance
- 5.4.2 Information Technology and Telecommunication
- 5.4.3 Government and Defense
- 5.4.4 Healthcare and Life Sciences
- 5.4.5 Retail and Ecommerce
- 5.4.6 Energy and Utilities
- 5.4.7 Other End-User Industries
- 5.5 By Geography
- 5.5.1 North America
- 5.5.1.1 United States
- 5.5.1.2 Canada
- 5.5.1.3 Mexico
- 5.5.2 South America
- 5.5.2.1 Brazil
- 5.5.2.2 Argentina
- 5.5.2.3 Rest of South America
- 5.5.3 Europe
- 5.5.3.1 United Kingdom
- 5.5.3.2 Germany
- 5.5.3.3 France
- 5.5.3.4 Russia
- 5.5.3.5 Rest of Europe
- 5.5.4 Asia Pacific
- 5.5.4.1 China
- 5.5.4.2 Japan
- 5.5.4.3 India
- 5.5.4.4 Australia
- 5.5.4.5 South Korea
- 5.5.4.6 Rest of Asia Pacific
- 5.5.5 Middle East
- 5.5.5.1 United Arab Emirates
- 5.5.5.2 Saudi Arabia
- 5.5.5.3 Turkey
- 5.5.5.4 Rest of Middle East
- 5.5.6 Africa
- 5.5.6.1 South Africa
- 5.5.6.2 Egypt
- 5.5.6.3 Nigeria
- 5.5.6.4 Rest of Africa
- 5.5.1 North America
6 COMPETITIVE LANDSCAPE
- 6.1 Market Concentration
- 6.2 Strategic Moves
- 6.3 Market Share Analysis
- 6.4 Company Profiles (includes Global level Overview, Market level overview, Core Segments, Financials as available, Strategic Information, Market Rank/Share for key companies, Products and Services, and Recent Developments)
- 6.4.1 International Business Machines Corporation
- 6.4.2 Cisco Systems Inc.
- 6.4.3 Palo Alto Networks Inc.
- 6.4.4 Splunk Inc.
- 6.4.5 Swimlane LLC
- 6.4.6 FireEye Inc.
- 6.4.7 DFLabs SpA
- 6.4.8 Siemplify Ltd
- 6.4.9 Tufin Software Technologies Ltd
- 6.4.10 RSA Security LLC
- 6.4.11 Fortinet Inc.
- 6.4.12 Rapid7 Inc.
- 6.4.13 LogRhythm Inc.
- 6.4.14 Cyberbit Ltd
- 6.4.15 Forescout Technologies Inc.
- 6.4.16 ThreatConnect Inc.
- 6.4.17 Securonix Inc.
- 6.4.18 Exabeam Inc.
- 6.4.19 Accenture PLC
- 6.4.20 Amazon Web Services Inc.
7 MARKET OPPORTUNITIES AND FUTURE OUTLOOK
- 7.1 White-Space and Unmet-Need Assessment

