PUBLISHER: Mordor Intelligence | PRODUCT CODE: 2123070

PUBLISHER: Mordor Intelligence | PRODUCT CODE: 2123070
United States Cookies - Market Share Analysis, Industry Trends & Statistics, Growth Forecasts (2026 - 2031)
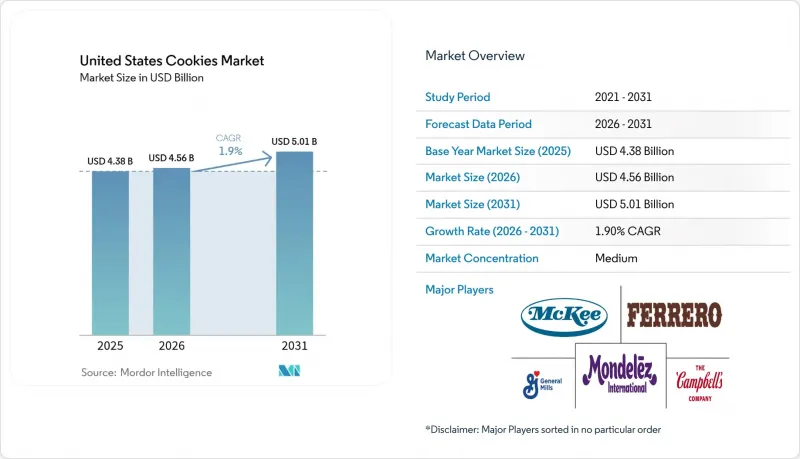
According to Mordor Intelligence, the United States cookies market size is expected to grow from USD 4.38 billion in 2025 to USD 4.56 billion in 2026 and is forecast to reach USD 5.01 billion by 2031, registering a 1.9% CAGR over 2026-2031.
This report is Segmented by Product Type (Bar Cookies, Molded/Drop Cookies, and More), Category (Conventional and Free-From), Packaging Type (Pouches, Boxes, and Others), Distribution Channel (Supermarkets/Hypermarkets, Convenience/Grocery Stores, and More) and Geography (Northeast, Midwest, South, and West). The Market Forecasts are Provided in Terms of Value (USD) and Volume (Tons).
United States Cookies Market Trends and Insights
Rising demand for portion-controlled indulgence snacks
Portion control has emerged as the primary demand catalyst, with 48.8% of US consumers snacking three or more times daily in 2025, creating sustained demand for individually wrapped formats that deliver sensory satisfaction without triggering portion-size guilt. Campbell Soup Company's Pepperidge Farm launched limited-edition Holiday Cookie Jar Collections in 2025, featuring portion-controlled ceramic containers that reinforce mindful consumption while enhancing gift appeal. Pending FDA warning-symbol proposals for products exceeding 10% of the daily value for saturated fat, sodium, or added sugar have hastened recipe tweaks that preserve indulgence while remaining within disclosure limits. Consequently, portion-controlled SKUs continue to record unit growth even as broader cookie unit sales turn slightly negative, underscoring how right-sizing can offset volume softness. This strategic positioning captures growing consumer willingness to pay premiums for products that support lifestyle goals rather than merely satisfying hunger.
Accelerated urban breakfast culture in metropolitan hubs
Urban breakfast culture is redefining cookie consumption occasions, particularly in Northeast and West metropolitan areas, where consumers actively seek "good for you" snacks that double as meal replacements. General Mills capitalized on this shift by launching Pillsbury Cinnamon Toast Crunch and Lucky Charms Soft Baked Cookies in January 2025, leveraging cereal brand equity to position cookies as acceptable breakfast items. The USDA's Smart Snacks in School regulations, which prohibit cookies from counting toward breakfast grain requirements and cap added sugars at 35% by weight, have paradoxically validated cookies as breakfast-adjacent snacks by establishing nutrient guardrails that manufacturers now use as product-development benchmarks. This breakfast-culture tailwind is most pronounced in the Northeast, where the region reflects dense urban populations with limited time for traditional morning meals and a willingness to pay for convenience formats.
Fluctuating raw-material costs impact cookie production margins
Raw-material volatility is compressing margins, with wheat season-average farm prices of USD 5.00 to USD 5.30 per bushel in 2025/26 and sugar stocks-to-use ratios tightening to 11.62% to 15.2%, creating input-cost inflation of approximately 3% to 4% of cost of goods sold. General Mills reported that input-cost inflation reached 3% to 4% of COGS in fiscal 2025, partially offset by holistic margin management savings of 4% to 5%, yet the company revised its full-year organic net sales outlook downward to a decline of 1.5% to 2% from an earlier projection of flat to 1% growth, signaling that pricing power remains constrained. Additionally, the increased butter prices complicate procurement planning that may prove disadvantageous if spot prices decline. Regional bakeries with limited hedging capabilities face acute margin pressure, as they lack the scale to negotiate multi-year supply agreements without triggering consumer backlash over recipe changes.
Other drivers and restraints analyzed in the detailed report include:
- Fortification and nutrient enhancement drive cookies market growth
- Plant-based fat reformulation driving growth
- Increased HFSS Regulations Create Market Challenges
For complete list of drivers and restraints, kindly check the Table Of Contents.
Segment Analysis
Bar cookies commanded 31.89% share of the market in 2025, anchored by granola-adjacent formats and brownie-inspired variants that position themselves as energy-dense snacks suitable for breakfast or post-workout recovery. General Mills' January 2025 launch of Cinnamon Toast Crunch and Golden Grahams Soft Baked Oat Bars leverages cereal brand equity to attract consumers who view bar formats as more nutritious than traditional cookies. Manufacturers are reformulating products in response to the FDA's proposed front-of-package labeling, using alternatives like allulose, monk fruit, and stevia to reduce added sugars and caloric density.
Sandwich and cream-filled cookies are projected to grow at a 2.02% CAGR through 2031, outpacing the broader market. Manufacturers are employing innovative filling technologies and nostalgic flavor combinations, allowing them to command premium prices. Unique flavors like salted caramel and red velvet have boosted cookie appeal. In May 2024, Mondelez's Oreo, holding a 40% share of the sweet cookie market, introduced gluten-free variants to target health-conscious consumers. AI-driven product development accelerates innovation, enabling swift responses to trends and consumer needs.
Conventional cookies retained 89.97% share in 2025, reflecting entrenched consumer preferences for familiar formulations and price points that remain 20% to 40% below free-from alternatives. The conventional segment benefits from economies of scale in ingredient procurement and production efficiency, enabling mass-market players to defend share through promotional pricing and multi-pack formats that deliver superior value per ounce. Organic certification, non-GMO verification, and other clean-label attributes are becoming table stakes even within the conventional segment, as consumers scrutinize ingredient panels and demand transparency around sourcing and processing methods.
The free-from segment is forecast to grow at 2.99% CAGR through 2031, driven by celiac disease prevalence and broader clean-label preferences that extend beyond diagnosed gluten intolerance. Mondelez's May 2024 launch of gluten-free Chips Ahoy, the brand's first allergen-free variant, signals mainstream adoption of free-from formulations that previously were confined to specialty brands such as Partake Foods and Tate's Bake Shop. However, a study published in April 2025 linking arsenic exposure to gluten-free diets has introduced a countervailing health concern that manufacturers must address through ingredient sourcing and testing protocols.
Complete Report Scope:
- By Product Type
- Bar Cookies
- Molded/Drop Cookies
- Sandwich and Cream-Filled Cookies
- Wafer and Rolled Cookies
- Butter/Shortbread and Plain Cookies
- Others
- By Category
- Conventional
- Free-from
- By Packaging Type
- Pouches
- Boxes
- Others
- By Distribution Channel
- Supermarkets/Hypermarkets
- Convenience/Grocery Stores
- Specialty Stores
- Online Retail Stores
- Other Distribution Channels
- By Geography
- Northeast
- Midwest
- South
- West
List of Companies Covered in this Report:
- Mondelez International
- The Campbell Soup Company
- Ferrero Group
- PepsiCo Inc.
- Mars Inc.
- General Mills Inc.
- Grupo Bimbo S.A.B. de C.V.
- McKee Foods Corporation
- Hostess Brands, LLC
- B&G Foods, Inc.
- Flowers Foods, Inc.
- Girl Scouts of the USA
- Otis Spunkmeyer (ARYZTA)
- Partake Foods
- Tate's Bake Shop
- Voortman Cookies Limited
- Lofthouse Cookies (TreeHouse Foods)
- Nonni's Foods LLC
- Thinsters (J&J Snack Foods)
- Mrs. Fields Original Cookies, Inc.
- Nestle SA
Additional Benefits:
- The market estimate (ME) sheet in Excel format
- 3 months of analyst support
TABLE OF CONTENTS
1 Introduction
- 1.1 Study Assumptions and Market Definition
- 1.2 Scope of the Study
2 Research Methodology
3 Executive Summary
4 Market Landscape
- 4.1 Market Overview
- 4.2 Market Drivers
- 4.2.1 Rising demand for portion-controlled indulgence snacks
- 4.2.2 Accelerated urban breakfast culture in metropolitan hubs
- 4.2.3 Fortification and nutrient enhancement drive cookies market growth
- 4.2.4 Plant-based fat reformulation driving growth
- 4.2.5 Direct-to-consumer subscription surge for gourmet cookies
- 4.2.6 Gift-giving and premiumization as emotional positioning
- 4.3 Market Restraints
- 4.3.1 Fluctuating raw-material costs impact cookie production margins
- 4.3.2 Increased HFSS regulations create market challenges
- 4.3.3 Food-safety compliance requirements
- 4.3.4 Growing market share of alternative snacking options
- 4.4 Consumer Behaviour Analysis
- 4.5 Regulatory Landscape
- 4.6 Technological Outlook
- 4.7 Porter's Five Forces
- 4.7.1 Threat of New Entrants
- 4.7.2 Bargaining Power of Buyers
- 4.7.3 Bargaining Power of Suppliers
- 4.7.4 Threat of Substitutes
- 4.7.5 Competitive Rivalry
5 Market Size and Growth Forecasts (Value and Volume)
- 5.1 By Product Type
- 5.1.1 Bar Cookies
- 5.1.2 Molded/Drop Cookies
- 5.1.3 Sandwich and Cream-Filled Cookies
- 5.1.4 Wafer and Rolled Cookies
- 5.1.5 Butter/Shortbread and Plain Cookies
- 5.1.6 Others
- 5.2 By Category
- 5.2.1 Conventional
- 5.2.2 Free-from
- 5.3 By Packaging Type
- 5.3.1 Pouches
- 5.3.2 Boxes
- 5.3.3 Others
- 5.4 By Distribution Channel
- 5.4.1 Supermarkets/Hypermarkets
- 5.4.2 Convenience/Grocery Stores
- 5.4.3 Specialty Stores
- 5.4.4 Online Retail Stores
- 5.4.5 Other Distribution Channels
- 5.5 By Geography
- 5.5.1 Northeast
- 5.5.2 Midwest
- 5.5.3 South
- 5.5.4 West
6 Competitive Landscape
- 6.1 Market Concentration
- 6.2 Strategic Moves
- 6.3 Market Share Analysis
- 6.4 Company Profiles (includes Global-level Overview, Market-level Overview, Core Segments, Financials as available, Strategic Information, Market Rank/Share for key companies, Products and Services, and Recent Developments)
- 6.4.1 Mondelez International
- 6.4.2 The Campbell Soup Company
- 6.4.3 Ferrero Group
- 6.4.4 PepsiCo Inc.
- 6.4.5 Mars Inc.
- 6.4.6 General Mills Inc.
- 6.4.7 Grupo Bimbo S.A.B. de C.V.
- 6.4.8 McKee Foods Corporation
- 6.4.9 Hostess Brands, LLC
- 6.4.10 B&G Foods, Inc.
- 6.4.11 Flowers Foods, Inc.
- 6.4.12 Girl Scouts of the USA
- 6.4.13 Otis Spunkmeyer (ARYZTA)
- 6.4.14 Partake Foods
- 6.4.15 Tate's Bake Shop
- 6.4.16 Voortman Cookies Limited
- 6.4.17 Lofthouse Cookies (TreeHouse Foods)
- 6.4.18 Nonni's Foods LLC
- 6.4.19 Thinsters (J&J Snack Foods)
- 6.4.20 Mrs. Fields Original Cookies, Inc.
- 6.4.21 Nestle SA
7 Market Opportunities and Future Outlook

