PUBLISHER: Mordor Intelligence | PRODUCT CODE: 2123406

PUBLISHER: Mordor Intelligence | PRODUCT CODE: 2123406
Pressure Labels - Market Share Analysis, Industry Trends & Statistics, Growth Forecasts (2026 - 2031)
According to Mordor Intelligence, the pressure labels market size is expected to grow from USD 23.55 billion in 2025 to USD 24.48 billion in 2026 and is forecast to reach USD 29.7 billion by 2031 at 3.94% CAGR over 2026-2031.
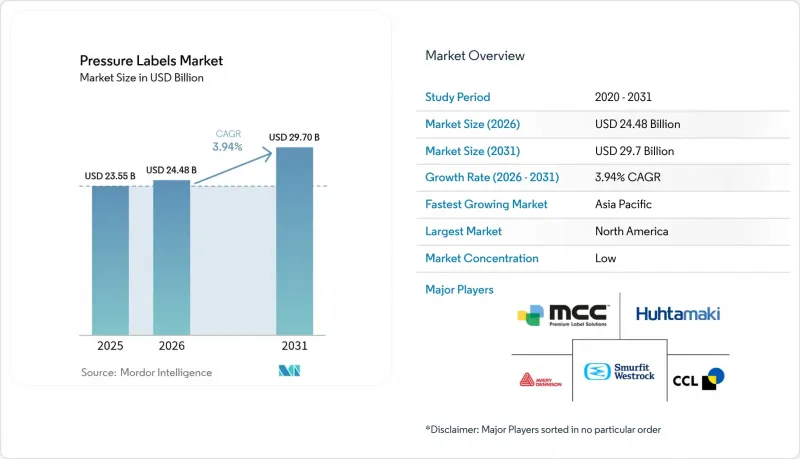
This report is Segmented by Print Process (Gravure, Flexography, Screen, Letterpress, Inkjet, and More), End-User (Food, Beverage, Healthcare, Cosmetics, Household, Industrial, and More), Adhesive Type (Water-Based Acrylic, Hot-Melt Rubber-Based, Solvent-Based, and UV-Curable), and Geography. The Market Forecasts are Provided in Terms of Value (USD).
Global Pressure Labels Market Trends and Insights
Growth of e-commerce and just-in-time logistics
Parcel volumes from online retail continue to rise, and warehouses now print millions of pressure-sensitive shipping labels daily. Logistics providers specify adhesives that survive conveyor abrasion yet peel away cleanly for carton reuse. UPM Adhesive Materials released removable logistics facestocks that support multiple delivery cycles. Brand owners also compress inventory buffers, so converters must supply customized labels within hours rather than weeks. This urgency favors digital presses that swap jobs with minimal downtime, reinforcing the growth of the pressure labels market.
Rise of short-run, variable-data digital printing
Digital technology lets converters personalize graphics, languages, and serial numbers on the fly. Gravure presses, while growing fastest for premium cosmetics, still require cylinders that add cost at short lengths. By contrast, toner and inkjet platforms can print serialized barcodes or regional designs without the need for plates. AGH Labels highlighted that high-definition single-pass metalized effects now match analog quality while cutting makeready waste. These capabilities underpin the projected 6.13% CAGR for gravure and strengthen overall pressure labels market resilience.
Volatility in raw-material (acrylic PSA) prices
Spot petrochemical hikes squeeze converter margins. The American Chemistry Council reported fractional global chemical output growth, signaling tight monomer supply. Producers hedge by shifting to bio-based tackifiers, such as SASOLWAX, which offers a 35% lower cradle-to-gate footprint and more stable pricing.
Other drivers and restraints analyzed in the detailed report include:
- Brand-owner demand for sustainable facestocks and liners
- Strict traceability mandates in food and pharma
- Stringent recyclability regulations limiting mixed-material labels
For complete list of drivers and restraints, kindly check the Table Of Contents.
Segment Analysis
Flexography contributed 38.12% of the 2025 revenue, underscoring its cost-effectiveness for long food labeling runs. Gravure printing, however, is projected to deliver a 5.86% CAGR as beauty and pharmaceutical buyers request photographic quality and metallic inks. The pressure labels market size for gravure formats is forecast to reach USD 7.53 billion by 2031, indicating a widening premium niche. Screen and letterpress retain loyal followings in tactile luxury packaging, while inkjet widens adoption in serialization.
Flexo converters mitigate raw-material fluctuations by optimizing setup waste and implementing UV-LED curing, which reduces power consumption. Gravure facilities utilize electromechanical engraving to reduce cylinder lead times, enabling faster introductions of new products. The pressure labels market benefits from this balanced technology mix, giving brand owners price-service options across application tiers. Regulatory audits also favor processes certified to ISO 9001:2015 and G7 color targets, prompting process upgrades even in emerging economies.
Complete Report Scope:
- By Print Process
- Gravure
- Flexography
- Screen
- Letterpress
- Inkjet
- Other Print Processes
- By End-User
- Food
- Beverage
- Healthcare
- Cosmetics
- Household
- Industrial
- Other End-user Industries
- By Adhesive Type
- Water-based Acrylic
- Hot-melt Rubber-based
- Solvent-based
- UV-curable
- By Geography
- North America
- United States
- Canada
- Mexico
- South America
- Brazil
- Argentina
- Chile
- Rest of South America
- Europe
- United Kingdom
- Germany
- France
- Italy
- Spain
- Russia
- Rest of Europe
- Asia-Pacific
- China
- India
- Japan
- South Korea
- Australia
- Rest of Asia-Pacific
- Middle East and Africa
- Middle East
- Saudi Arabia
- United Arab Emirates
- Turkey
- Rest of Middle East
- Africa
- South Africa
- Nigeria
- Rest of Africa
- Middle East
- North America
Geography Analysis
North America generated 39.05% of 2025 revenue, anchored by strict traceability legislation and sophisticated retail automation. The Drug Supply Chain Security Act and the Food Safety Modernization Act sustain annual demand for serialized labels across the pharmaceutical and leafy green industries. CCL Industries logged 8.6% sales growth in Q1 2025, reflecting steady converter margins despite input volatility. Investments at UPM's Mills River site add premium wine, spirits, and postal laminates, ensuring local supply.
The Asia-Pacific region is projected to record the fastest growth, with a 5.33% CAGR through 2031, as rising disposable incomes drive demand for packaged cosmetics and ready-to-drink teas. UPM's Johor Bahru coating line will supply filmic and electronics labels to meet regional electronics exports. Extended Producer Responsibility laws in the Philippines and Vietnam stimulate demand for wash-off or linerless labels. Domestic converters invest in digital presses to offer multilingual versions for ASEAN's mobile consumer base. The pressure labels market is seeing supply-chain shifts as global brands relocate plants closer to Jakarta, Ho Chi Minh City, and Bengaluru.
Europe maintains moderate growth underpinned by ambitious recycling targets and advanced collection systems. The Packaging and Packaging Waste Regulation pressures converters to prove compatibility with household sorters. APR-certified label-container systems earn eco-modulated fees that lower extended producer costs, encouraging adopters. Pharmaceutical serialization, complete since 2019, sustains recurring code-label purchases. Brexit regulatory divergence adds complexity, but established players adapt swiftly, preserving customer loyalty. Together these factors keep the pressure labels market in Europe on a stable upward path.
- CCL Industries Inc.
- Avery Dennison Corporation
- Multi-Color Corporation
- Fuji Seal International Inc.
- Smurfit WestRock plc
- Huhtamaki Oyj
- Taghleef Industries LLC
- Coveris Group
- UPM Raflatac
- Taylor Corporation
- Constantia Flexibles Group GmbH
- Herma GmbH
- Skanem AS
- Resource Label Group, LLC
- Beontag Group
- Schreiner Group GmbH & Co. KG
- SATO Holdings Corporation
- Inland Packaging LLC
Additional Benefits:
- The market estimate (ME) sheet in Excel format
- 3 months of analyst support
TABLE OF CONTENTS
1 INTRODUCTION
- 1.1 Study Assumptions and Market Definition
- 1.2 Scope of the Study
2 RESEARCH METHODOLOGY
3 EXECUTIVE SUMMARY
4 MARKET LANDSCAPE
- 4.1 Market Overview
- 4.2 Market Drivers
- 4.2.1 Growth of e-commerce and just-in-time logistics
- 4.2.2 Rise of short-run, variable-data digital printing
- 4.2.3 Brand-owner demand for sustainable facestocks and liners
- 4.2.4 Strict traceability mandates in food and pharma
- 4.2.5 Adoption of liner-less pressure labels in retail automation
- 4.2.6 Smart labels with printed electronics for cold-chain monitoring
- 4.3 Market Restraints
- 4.3.1 Volatility in raw-material (acrylic PSA) prices
- 4.3.2 Stringent recyclability regulations limiting mixed-material labels
- 4.3.3 Limited durability in extreme temperatures and UV exposure
- 4.3.4 Capital-intensive transition to digital presses for converters
- 4.4 Industry Supply-Chain Analysis
- 4.5 Regulatory Landscape
- 4.6 Technological Outlook
- 4.7 Porter's Five Forces Analysis
- 4.7.1 Threat of New Entrants
- 4.7.2 Bargaining Power of Suppliers
- 4.7.3 Bargaining Power of Buyers
- 4.7.4 Threat of Substitutes
- 4.7.5 Industry Rivalry
5 MARKET SIZE AND GROWTH FORECASTS (VALUE)
- 5.1 By Print Process
- 5.1.1 Gravure
- 5.1.2 Flexography
- 5.1.3 Screen
- 5.1.4 Letterpress
- 5.1.5 Inkjet
- 5.1.6 Other Print Processes
- 5.2 By End-User
- 5.2.1 Food
- 5.2.2 Beverage
- 5.2.3 Healthcare
- 5.2.4 Cosmetics
- 5.2.5 Household
- 5.2.6 Industrial
- 5.2.7 Other End-user Industries
- 5.3 By Adhesive Type
- 5.3.1 Water-based Acrylic
- 5.3.2 Hot-melt Rubber-based
- 5.3.3 Solvent-based
- 5.3.4 UV-curable
- 5.4 By Geography
- 5.4.1 North America
- 5.4.1.1 United States
- 5.4.1.2 Canada
- 5.4.1.3 Mexico
- 5.4.2 South America
- 5.4.2.1 Brazil
- 5.4.2.2 Argentina
- 5.4.2.3 Chile
- 5.4.2.4 Rest of South America
- 5.4.3 Europe
- 5.4.3.1 United Kingdom
- 5.4.3.2 Germany
- 5.4.3.3 France
- 5.4.3.4 Italy
- 5.4.3.5 Spain
- 5.4.3.6 Russia
- 5.4.3.7 Rest of Europe
- 5.4.4 Asia-Pacific
- 5.4.4.1 China
- 5.4.4.2 India
- 5.4.4.3 Japan
- 5.4.4.4 South Korea
- 5.4.4.5 Australia
- 5.4.4.6 Rest of Asia-Pacific
- 5.4.5 Middle East and Africa
- 5.4.5.1 Middle East
- 5.4.5.1.1 Saudi Arabia
- 5.4.5.1.2 United Arab Emirates
- 5.4.5.1.3 Turkey
- 5.4.5.1.4 Rest of Middle East
- 5.4.5.2 Africa
- 5.4.5.2.1 South Africa
- 5.4.5.2.2 Nigeria
- 5.4.5.2.3 Rest of Africa
- 5.4.5.1 Middle East
- 5.4.1 North America
6 COMPETITIVE LANDSCAPE
- 6.1 Market Concentration
- 6.2 Strategic Moves
- 6.3 Market Share Analysis
- 6.4 Company Profiles (includes Global level Overview, Market level overview, Core Segments, Financials as available, Strategic Information, Market Rank/Share for key companies, Products and Services, and Recent Developments)
- 6.4.1 CCL Industries Inc.
- 6.4.2 Avery Dennison Corporation
- 6.4.3 Multi-Color Corporation
- 6.4.4 Fuji Seal International Inc.
- 6.4.5 Smurfit WestRock plc
- 6.4.6 Huhtamaki Oyj
- 6.4.7 Taghleef Industries LLC
- 6.4.8 Coveris Group
- 6.4.9 UPM Raflatac
- 6.4.10 Taylor Corporation
- 6.4.11 Constantia Flexibles Group GmbH
- 6.4.12 Herma GmbH
- 6.4.13 Skanem AS
- 6.4.14 Resource Label Group, LLC
- 6.4.15 Beontag Group
- 6.4.16 Schreiner Group GmbH & Co. KG
- 6.4.17 SATO Holdings Corporation
- 6.4.18 Inland Packaging LLC
7 MARKET OPPORTUNITIES AND FUTURE OUTLOOK
- 7.1 White-space and Unmet-need Assessment

