PUBLISHER: Mordor Intelligence | PRODUCT CODE: 2123581

PUBLISHER: Mordor Intelligence | PRODUCT CODE: 2123581
Ambulance Services - Market Share Analysis, Industry Trends & Statistics, Growth Forecasts (2026 - 2031)
According to Mordor Intelligence, the ambulance services market size was valued at USD 60.40 billion in 2025 and estimated to grow from USD 65.19 billion in 2026 to reach USD 95.55 billion by 2031, at a CAGR of 7.94% during the forecast period (2026-2031).
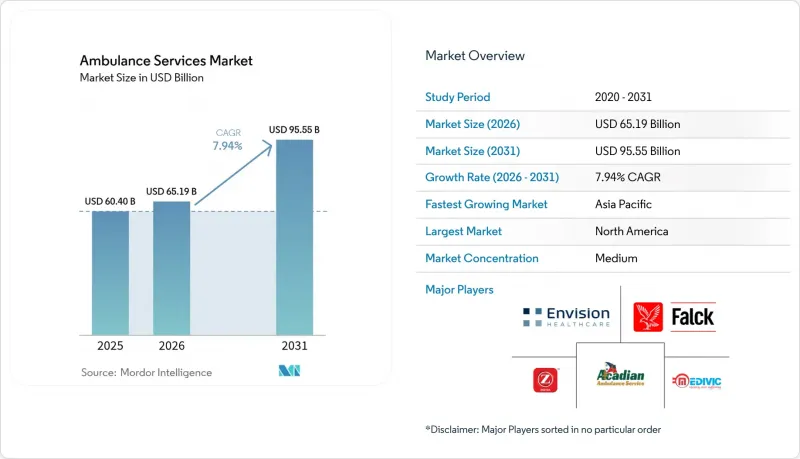
This report is Segmented by Mode of Transport (Air Ambulance, Water Ambulance, and Ground Ambulance), Equipment (Basic Life Support Services, and More), Type of Service (Emergency Services, and Non-Emergency Services), Ownership (Government/Municipal, and More), and Geography (North America, Europe, Asia-Pacific, and More). The Market Sizes and Forecasts are Provided in Terms of Value (USD).
Global Ambulance Services Market Trends and Insights
Rising Global Trauma & Cardiovascular Emergencies
Cardiac arrest incidents reached 137,119 across U.S. jurisdictions in 2024, equating to an incidence of 78.7 per 100,000 population. Bystander CPR rates remain below 50%, heightening reliance on rapid paramedic response. Older-adult falls continue to drive roughly 3 million emergency department visits each year in the United States. U.S. traffic collisions caused 42,514 fatalities in 2024, reinforcing the need for trauma-capable fleets. Together, these acute events form a demand baseline that is largely immune to macroeconomic swings.
Ageing Demographics & Chronic-Disease Burden
By 2035, adults aged 65 and older will account for 22% of the U.S. population, and in Japan, older adults already account for 62% of ambulance transports. Medicare beneficiaries average 1.8 ambulance rides per year, compared with 0.3 in the general population. India's 108 network logged a 28% increase in geriatric calls between 2023 and 2025. The prevalence of COPD, heart failure, and diabetes complications necessitates ALS-equipped vehicles able to administer IV drugs and CPAP during transport. This demographic shift is set to maintain upward pressure on fleet capacity and specialized staffing.
High Capital & Operating Expenditure
ALS-ready Type III vans cost USD 150,000-300,000, and air ambulance helicopters require USD 3-5 million, excluding hangar investments. Operating outlays range from USD 1.5 to 3 million annually for small systems, with labor accounting for up to 70% of the spend. Medicare's 2024 fee-schedule bump of 1.3% trails the 4.2% annual cost rise reported by the American Ambulance Association. Electric units promise lower lifetime expenses yet remain price-premium purchases. Rural providers often depend on municipal subsidies or volunteer staffing to remain solvent.
Other drivers and restraints analyzed in the detailed report include:
- Public-Private Funding Programmes Expanding EMS Networks
- Tele-EMS Integration & Real-Time Clinical Decision Support
- Shortage of Trained Paramedics & Pilots
For complete list of drivers and restraints, kindly check the Table Of Contents.
Segment Analysis
Ground vehicles accounted for 70.55% of 2025 revenue in the ambulance services market, underscoring their primacy in urban response. Air units are expanding at a 10.25% CAGR as rural trauma and interfacility critical-care needs multiply. The ambulance services market for rotary-wing missions is projected to expand as metropolitan rooftop helipads open and reimbursement parity with ground ALS trips is achieved. Type III vans dominate mixed-acuity fleets owing to modular interior space, whereas heavy truck-based Type I models support bulky cardiac equipment in suburban ALS calls. Electric propulsion trials in New York and London indicate diesel displacement potential once battery costs fall below USD 200/kWh. Air fleets are differentiating via night-vision avionics and satellite tele-ICU links that extend physician oversight mid-flight. Fixed-wing craft cater to long-range repatriations beyond 150 nautical miles, bridging tertiary-care gaps in archipelagos and desert regions.
Aerial providers are integrating AI-driven route optimization to minimize weather diversions, boosting dispatch reliability. Regulatory acceleration under FAA Part 135 amendments is expected to streamline cross-state licensing of medical crews, promoting multi-base network scaling. Meanwhile, water ambulances serve niche geographies such as Venice, handling 30,000 annual calls and proving essential for cities bisected by waterways. Electric fleets could reshape cost structures, but initial procurement premiums remain a hurdle for tax-constrained municipalities.
BLS rigs retained 45.53% revenue in 2025 across the ambulance services market, reflecting high-frequency, low-acuity transports paid on volume. ALS configurations are on a 9.75% CAGR trajectory, capturing expanding reimbursement differentials as payers reward pre-hospital ECG transmission and advanced airway interventions. The ambulance services market's advantage in ALS size grows when bundled payments tie outcomes to early treatment initiation. Specialty Care Transport, although a fraction of total runs, commands the highest per-trip revenue by moving ECMO and neonatal ICU patients between tertiary centers. Point-of-care ultrasound adoption is blurring traditional BLS-ALS boundaries and could recalibrate pricing models. CAMTS accreditation is aligning SCT standards globally, easing cross-border patient transfers.
Financially, ALS equipment packages cost USD 50,000-80,000, triple BLS equivalents, yet pay back faster under value-based reimbursement. Portable lab analyzers and mechanical CPR devices enhance survival metrics, underpinning payer willingness to reimburse at premium rates. Lower-tech BLS fleets risk margin erosion from rideshare NEMT competitors unless paired with bundled hospital discharge contracts.
Complete Report Scope:
- By Mode of Transport
- Air Ambulance
- Rotary-Wing
- Fixed-Wing
- Water Ambulance
- Ground Ambulance
- Type III Van
- Type I/II Modular
- Hybrid-Electric/EV Ambulance
- Air Ambulance
- By Equipment
- Basic Life Support (BLS) Services
- Advanced Life Support (ALS) Services
- Specialty Care Transport (SCT)
- By Type of Service
- Emergency Services
- Non-Emergency Services
- By Ownership
- Government/Municipal
- Private Corporate
- Hospital-Based
- Volunteer/NGO
- By Geography
- North America
- United States
- Canada
- Mexico
- Europe
- Germany
- United Kingdom
- France
- Italy
- Spain
- Rest of Europe
- Asia-Pacific
- China
- India
- Japan
- Australia
- South Korea
- Rest of Asia-Pacific
- Middle East and Africa
- GCC
- South Africa
- Rest of Middle East and Africa
- South America
- Brazil
- Argentina
- Rest of South America
- North America
Geography Analysis
North America captured 35.23% of global revenue in 2025, driven by high per-capita spend and comprehensive insurance coverage. The United States alone fields more than 20,000 EMS agencies with heterogeneous fire, hospital, and private ownership patterns. Provincial consolidation in Canada trimmed administrative overhead by 22% following British Columbia's 2024 integration, evidence of scale benefits. Mexico's expansion remains uneven due to fiscal constraints.
Asia-Pacific's 9.12% CAGR rise is propelled by Chinese and Indian infrastructure mandates. China's 10-minute urban response standard, due in 2027, has moved fleet orders to provincial budgets. India's 108 network deployment across 120 new districts brings rural coverage into parity with urban centers. Japan manages demographic pressure, as older adults already account for 62% of ambulance transports. Australia's Royal Flying Doctor Service underscores the importance of aeromedical coverage over vast geographies.
Europe benefits from universal insurance and regulatory harmonization. Germany's tele-physician program trims on-scene times and boosts survival odds. The United Kingdom trialed electric ambulances to satisfy clean-air rules, foreshadowing wider fleet conversions. GCC states such as the UAE achieve sub-eight-minute urban response through centralized command centers. South America remains fragmented; Brazil's SAMU relies on federal funding while private players dominate in Argentina and Chile.
- Acadian Ambulance Service
- Aero Asahi Corporation
- Air Charter Services Ltd
- Air Medical Group Holdings
- Air Methods
- American Medical Response
- BVG India
- CareFlight International
- Dutch Health B.V.
- EMS Group
- Envision Healthcare
- Express Ambulances India
- Falck A/S
- Global Medical Response (GMR)
- GVK EMRI
- Lifeline Ambulance Services
- London Ambulance Service NHS Trust
- Medivic Aviation
- National Ambulance LLC
- PHI Air Medical
- REVA Air Ambulance
- SA Ambulance Service
- Scandinavian AirAmbulance
- St John Ambulance Australia
- Ziqitza Health Care Ltd
Additional Benefits:
- The market estimate (ME) sheet in Excel format
- 3 months of analyst support
TABLE OF CONTENTS
1 Introduction
- 1.1 Study Assumptions & Market Definition
- 1.2 Scope of the Study
2 Research Methodology
3 Executive Summary
4 Market Landscape
- 4.1 Market Overview
- 4.2 Market Drivers
- 4.2.1 Rising Global Trauma & Cardiovascular Emergencies
- 4.2.2 Ageing Demographics & Chronic-Disease Burden
- 4.2.3 Public-Private Funding Programmes Expanding EMS Networks
- 4.2.4 Tele-EMS Integration & Real-Time Clinical Decision Support
- 4.2.5 Emergence of Electric/EV Ambulances Lowering Life-Cycle Cost
- 4.2.6 Drone-Enabled Rapid First-Response Kits in Remote Zones
- 4.3 Market Restraints
- 4.3.1 High Capital & Operating Expenditure
- 4.3.2 Shortage of Trained Paramedics & Pilots
- 4.3.3 Competitive Pressure from Rideshare Health-Transport Services
- 4.3.4 Fragmented Multi-Jurisdictional Accreditation Inflating Compliance Cost
- 4.4 Value Chain Analysis
- 4.5 Regulatory Landscape
- 4.6 Technological Outlook
- 4.7 Porter's Five Forces
- 4.7.1 Threat of New Entrants
- 4.7.2 Bargaining Power of Buyers
- 4.7.3 Bargaining Power of Suppliers
- 4.7.4 Threat of Substitutes
- 4.7.5 Intensity of Competitive Rivalry
5 Market Size & Growth Forecasts (Value, USD)
- 5.1 By Mode of Transport
- 5.1.1 Air Ambulance
- 5.1.1.1 Rotary-Wing
- 5.1.1.2 Fixed-Wing
- 5.1.2 Water Ambulance
- 5.1.3 Ground Ambulance
- 5.1.3.1 Type III Van
- 5.1.3.2 Type I/II Modular
- 5.1.3.3 Hybrid-Electric/EV Ambulance
- 5.1.1 Air Ambulance
- 5.2 By Equipment
- 5.2.1 Basic Life Support (BLS) Services
- 5.2.2 Advanced Life Support (ALS) Services
- 5.2.3 Specialty Care Transport (SCT)
- 5.3 By Type of Service
- 5.3.1 Emergency Services
- 5.3.2 Non-Emergency Services
- 5.4 By Ownership
- 5.4.1 Government/Municipal
- 5.4.2 Private Corporate
- 5.4.3 Hospital-Based
- 5.4.4 Volunteer/NGO
- 5.5 By Geography
- 5.5.1 North America
- 5.5.1.1 United States
- 5.5.1.2 Canada
- 5.5.1.3 Mexico
- 5.5.2 Europe
- 5.5.2.1 Germany
- 5.5.2.2 United Kingdom
- 5.5.2.3 France
- 5.5.2.4 Italy
- 5.5.2.5 Spain
- 5.5.2.6 Rest of Europe
- 5.5.3 Asia-Pacific
- 5.5.3.1 China
- 5.5.3.2 India
- 5.5.3.3 Japan
- 5.5.3.4 Australia
- 5.5.3.5 South Korea
- 5.5.3.6 Rest of Asia-Pacific
- 5.5.4 Middle East and Africa
- 5.5.4.1 GCC
- 5.5.4.2 South Africa
- 5.5.4.3 Rest of Middle East and Africa
- 5.5.5 South America
- 5.5.5.1 Brazil
- 5.5.5.2 Argentina
- 5.5.5.3 Rest of South America
- 5.5.1 North America
6 Competitive Landscape
- 6.1 Market Concentration
- 6.2 Market Share Analysis
- 6.3 Company Profiles (includes Global-level Overview, Market-level Overview, Core Segments, Financials as available, Strategic Information, Market Rank/Share, Products & Services, Recent Developments)
- 6.3.1 Acadian Ambulance Service Inc.
- 6.3.2 Aero Asahi Corporation
- 6.3.3 Air Charter Services Ltd
- 6.3.4 Air Medical Group Holdings
- 6.3.5 Air Methods Corporation
- 6.3.6 American Medical Response
- 6.3.7 BVG India Ltd
- 6.3.8 CareFlight International
- 6.3.9 Dutch Health B.V.
- 6.3.10 EMS Group
- 6.3.11 Envision Healthcare Corporation
- 6.3.12 Express Ambulances India
- 6.3.13 Falck A/S
- 6.3.14 Global Medical Response (GMR)
- 6.3.15 GVK EMRI
- 6.3.16 Lifeline Ambulance Services
- 6.3.17 London Ambulance Service NHS Trust
- 6.3.18 Medivic Aviation
- 6.3.19 National Ambulance LLC
- 6.3.20 PHI Air Medical
- 6.3.21 REVA Air Ambulance
- 6.3.22 SA Ambulance Service
- 6.3.23 Scandinavian AirAmbulance
- 6.3.24 St John Ambulance Australia
- 6.3.25 Ziqitza Health Care Ltd
7 Market Opportunities & Future Outlook
- 7.1 White-Space & Unmet-Need Assessment

