PUBLISHER: Mordor Intelligence | PRODUCT CODE: 2123778

PUBLISHER: Mordor Intelligence | PRODUCT CODE: 2123778
Progressing Cavity Pump - Market Share Analysis, Industry Trends & Statistics, Growth Forecasts (2026 - 2031)
According to Mordor Intelligence, the progressing cavity pump market size is expected to grow from USD 1.64 billion in 2025 to USD 1.73 billion in 2026 and is forecast to reach USD 2.27 billion by 2031 at 5.55% CAGR over 2026-2031.
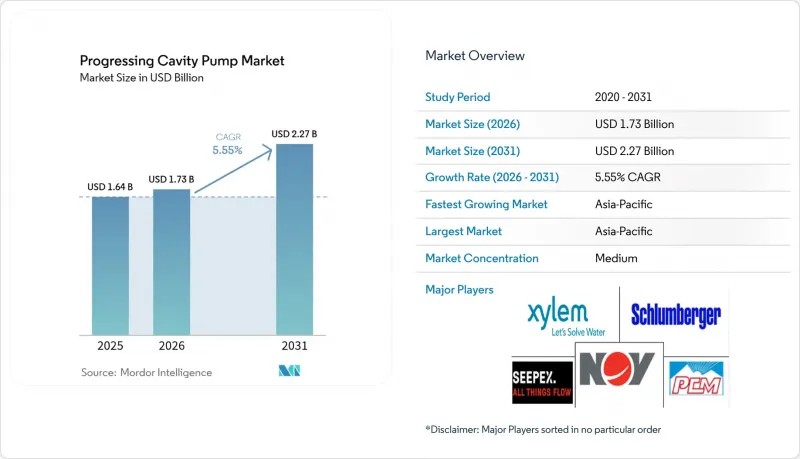
This report is Segmented by Power Rating (Up To 50 HP, 51-150 HP, Above 150 HP), Pumping Capacity (Up To 500 GPM, 501-1000 GPM, and More), Stage Type (Single-Stage, Multistage), End-User Industry (Water and Wastewater, Oil and Gas, and More), and Geography (North America, South America, and More). The Market Forecasts are Provided in Terms of Value (USD).
Global Progressing Cavity Pump Market Trends and Insights
Rising demand from water and wastewater infrastructure
Major municipal programs have been driving steady orders for progressing cavity pumps used in sludge transfer, thickening, and chemical dosing. Manila Water commissioned a USD 435.73 million pumping station that delivers 50 million liters per day to Binangonan households. Japan's USD 10 billion Water 2040 Fund channels capital into decentralized recycling systems that rely on high-precision PCPs for nutrient recovery. The European Union's revised Urban Wastewater Treatment Directive mandates energy-neutral plants by 2045, turning efficient PCPs into compliance tools. Indonesia's new capital project reinforces regional demand by requiring advanced sludge technology for 2 million future residents. These programs collectively lengthen replacement cycles and open retrofit opportunities for hopper-type PCPs that handle dewatered cakes with minimal footprint.
Suitability for high-viscosity and multiphase fluids
Progressing cavity pumps transfer shear-sensitive, sand-laden, or gas-cut fluids at near-constant flow, a performance unmatched by centrifugal or gear pumps. NETZSCH's new conical rotor design reached 75-90% volumetric efficiency even under high sand and gas content. Canadian SAGD producers raised recovery rates above 80%, which in turn lifted PCP run hours per well as operators lifted heavy emulsions to surface. Emerging solvent-SAGD schemes using butane-propane blends heighten viscosity challenges that favor PCP adoption. Food processors also deploy PCPs to protect texture in viscous sauces, while chemical firms value the elastomer stator's corrosion resistance over metal alternatives.
High deployment and maintenance cost
Life-cycle economics remain a hurdle for widespread adoption, especially in price-sensitive plants. Stator replacement intervals ranged from 6 months to 3 years depending on solids load, making elastomer cost a major budget item. Mechanical seals, large skid bases, and sensor packages push installed costs beyond low-shear alternatives. Comparative studies by Graco noted higher maintenance hours for PCPs versus peristaltic pumps in similar dosing duties. Small utilities in developing regions delay upgrades because specialized technicians and spares are scarce, extending payback periods.
Other drivers and restraints analyzed in the detailed report include:
- Investments in heavy-oil artificial-lift projects
- Electric-submersible PCPs lowering power use
- Abrasive wear in sand-laden produced fluids
For complete list of drivers and restraints, kindly check the Table Of Contents.
Segment Analysis
The up to 50 HP class retained 43.62% of the progressing cavity pump market share in 2025 because small water plants and light industry favor modest power draws. The 51-150 HP bracket, however, is expanding at an 8.05% CAGR and is set to close the gap as digital controllers raise efficiency and cut downtime. Variable-frequency drives paired with mid-range motors achieve 20-30% energy savings, a benefit that appeals to municipal operators with tiered electricity tariffs.
Electric-submersible formats thrive in the same power window, opening new upstream uses where rod strings were space-constrained. Machine-learning sizing tools that predict optimal horsepower now deliver higher accuracy, with chances of error being as low as 0.1%, thus helping engineers use the right-size equipment and prevent overspend. As these analytics mature, the progressing cavity pump market is expected to allocate a greater share of new orders to the 51-150 HP category while low-horsepower units remain dominant in legacy facilities.
High-capacity systems ranging from 501-1,000 GPM posted the fastest 8.52% CAGR as municipalities replaced aging equipment with larger units to keep pace with population growth. Manila Water's East Bay facility installed multiple large-bore PCPs to move 50 million L/day, illustrating the scale of new projects. The <=500 GPM segment still controlled 46.78% of revenue in 2025 because thousands of food, chemical, and small treatment plants operate within that flow envelope.
Advanced CFD modeling lets manufacturers optimize rotor geometry for each flow band, raising volumetric efficiency to 75-90% across capacities. Digital twins add predictive insights that alert operators to deviations before cavitation sets in. Together, these advances keep life-cycle costs in check and sustain the progressing cavity pump market's penetration into high-flow duties once reserved for centrifugal machines.
Complete Report Scope:
- By Power Rating
- Up to 50 HP
- 51 - 150 HP
- Above 150 HP
- By Pumping Capacity
- Up to 500 GPM
- 501 - 1000 GPM
- Above 1000 GPM
- By Stage Type
- Single-stage (< 12 stages)
- Multistage (> 12 stages)
- By End-User Industry
- Water and Wastewater
- Oil and Gas
- Chemicals and Petrochemicals
- Food and Beverage
- Other End-Users
- By Geography
- North America
- United States
- Canada
- Mexico
- South America
- Brazil
- Argentina
- Rest of South America
- Europe
- Germany
- United Kingdom
- France
- Russia
- Rest of Europe
- Asia-Pacific
- China
- Japan
- South Korea
- India
- Rest of Asia-Pacific
- Middle East and Africa
- Middle East
- Saudi Arabia
- United Arab Emirates
- Turkey
- Rest of Middle East
- Africa
- South Africa
- Nigeria
- Rest of Africa
- Middle East
- North America
Geography Analysis
Asia-Pacific held 34.21% of the progressing cavity pump market in 2025 and is projected to expand at a 8.72% CAGR to 2031. China's USD 10 billion Water 2040 Fund and Japan's near-closed-loop recycling systems underpin sustained municipal spending. Indonesia's new capital Nusantara opens a multiyear tender pipeline for sludge and dosing equipment. High-growth manufacturing hubs in India and Vietnam add industrial orders that diversify regional revenue.
North America maintains a strong base through heavy-oil production and water infrastructure refurbishment. Canadian SAGD production averaged 1.65 million bpd in 2025, driving lift system replacements and expansions. The United States faces USD 232 million in annual compliance costs once the EPA's proposed effluent guidelines take full effect, incentivizing utilities to upgrade to energy-efficient PCPs.
Europe's market revolves around regulatory compliance and efficiency targets. The Urban Wastewater Treatment Directive's energy-neutral mandate sets a hard deadline that favors low-slip PCPs. Germany and the United Kingdom invest heavily in technology upgrades for chemical dosing and digester feed, while France's nuclear plants demand robust, leak-free pumps. Eastern Europe and Russia provide incremental revenue through oil production projects despite geopolitical uncertainty.
- Schlumberger Limited
- National Oilwell Varco, Inc.
- Xylem Inc.
- NETZSCH Holding GmbH & Co. KG
- PCM S.A.
- Weatherford International plc
- Halliburton Company
- Seepex GmbH
- ChampionX Corporation
- Moyno, LLC
- Roto Pumps Limited
- Pumpenfabrik Wangen GmbH
- Leistritz Pumpen GmbH
- Liberty Process Equipment, Inc.
- Verder Liquids BV
- Borets International Limited
- Canadian Advanced ESP Inc.
- John Crane Production Solutions, Inc.
- Baker Hughes Company
- C-Flex Pump Company
- Allweiler GmbH (CIRCOR Intl.)
- Atlas Copco AB (Varisco PCP line)
- Graco Inc.
- NETCO Pumps & Equipment Pty Ltd
- BBP Pumps BV
- Shanley Pump & Equipment, Inc.
Additional Benefits:
- The market estimate (ME) sheet in Excel format
- 3 months of analyst support
TABLE OF CONTENTS
1 INTRODUCTION
- 1.1 Study Assumptions and Market Definition
- 1.2 Scope of the Study
2 RESEARCH METHODOLOGY
3 EXECUTIVE SUMMARY
4 MARKET LANDSCAPE
- 4.1 Market Overview
- 4.2 Market Drivers
- 4.2.1 Rising demand from water and wastewater infrastructure
- 4.2.2 Suitability for high-viscosity and multiphase fluids
- 4.2.3 Investments in heavy-oil artificial-lift (PCP) projects
- 4.2.4 Electric-submersible PCPs lowering power use (under-radar)
- 4.2.5 IoT-enabled predictive maintenance for stator-rotor wear (under-radar)
- 4.2.6 Sludge-dewatering regulations spurring hopper-type PCP retrofits (under-radar)
- 4.3 Market Restraints
- 4.3.1 High deployment and maintenance cost
- 4.3.2 Abrasive wear in sand-laden produced fluids
- 4.3.3 Elastomer supply-chain volatility (under-radar)
- 4.3.4 Peristaltic-hose pump substitution in low-flow dosing (under-radar)
- 4.4 Impact of Macroeconomic Factors
- 4.5 Value Chain Analysis
- 4.6 Regulatory Landscape
- 4.7 Technological Outlook
- 4.8 Porter's Five Forces Analysis
- 4.8.1 Bargaining Power of Suppliers
- 4.8.2 Bargaining Power of Buyers
- 4.8.3 Threat of New Entrants
- 4.8.4 Threat of Substitutes
- 4.8.5 Intensity of Competitive Rivalry
- 4.9 Assessment of Impact of Macroeconomic Factors
5 MARKET SIZE AND GROWTH FORECASTS (VALUE)
- 5.1 By Power Rating
- 5.1.1 Up to 50 HP
- 5.1.2 51 - 150 HP
- 5.1.3 Above 150 HP
- 5.2 By Pumping Capacity
- 5.2.1 Up to 500 GPM
- 5.2.2 501 - 1000 GPM
- 5.2.3 Above 1000 GPM
- 5.3 By Stage Type
- 5.3.1 Single-stage (? 12 stages)
- 5.3.2 Multistage (> 12 stages)
- 5.4 By End-User Industry
- 5.4.1 Water and Wastewater
- 5.4.2 Oil and Gas
- 5.4.3 Chemicals and Petrochemicals
- 5.4.4 Food and Beverage
- 5.4.5 Other End-Users
- 5.5 By Geography
- 5.5.1 North America
- 5.5.1.1 United States
- 5.5.1.2 Canada
- 5.5.1.3 Mexico
- 5.5.2 South America
- 5.5.2.1 Brazil
- 5.5.2.2 Argentina
- 5.5.2.3 Rest of South America
- 5.5.3 Europe
- 5.5.3.1 Germany
- 5.5.3.2 United Kingdom
- 5.5.3.3 France
- 5.5.3.4 Russia
- 5.5.3.5 Rest of Europe
- 5.5.4 Asia-Pacific
- 5.5.4.1 China
- 5.5.4.2 Japan
- 5.5.4.3 South Korea
- 5.5.4.4 India
- 5.5.4.5 Rest of Asia-Pacific
- 5.5.5 Middle East and Africa
- 5.5.5.1 Middle East
- 5.5.5.1.1 Saudi Arabia
- 5.5.5.1.2 United Arab Emirates
- 5.5.5.1.3 Turkey
- 5.5.5.1.4 Rest of Middle East
- 5.5.5.2 Africa
- 5.5.5.2.1 South Africa
- 5.5.5.2.2 Nigeria
- 5.5.5.2.3 Rest of Africa
- 5.5.5.1 Middle East
- 5.5.1 North America
6 COMPETITIVE LANDSCAPE
- 6.1 Market Concentration
- 6.2 Strategic Moves
- 6.3 Market Share Analysis
- 6.4 Company Profiles (includes Global level Overview, Market level overview, Core Segments, Financials as available, Strategic Information, Market Rank/Share for key companies, Products and Services, and Recent Developments)
- 6.4.1 Schlumberger Limited
- 6.4.2 National Oilwell Varco, Inc.
- 6.4.3 Xylem Inc.
- 6.4.4 NETZSCH Holding GmbH & Co. KG
- 6.4.5 PCM S.A.
- 6.4.6 Weatherford International plc
- 6.4.7 Halliburton Company
- 6.4.8 Seepex GmbH
- 6.4.9 ChampionX Corporation
- 6.4.10 Moyno, LLC
- 6.4.11 Roto Pumps Limited
- 6.4.12 Pumpenfabrik Wangen GmbH
- 6.4.13 Leistritz Pumpen GmbH
- 6.4.14 Liberty Process Equipment, Inc.
- 6.4.15 Verder Liquids BV
- 6.4.16 Borets International Limited
- 6.4.17 Canadian Advanced ESP Inc.
- 6.4.18 John Crane Production Solutions, Inc.
- 6.4.19 Baker Hughes Company
- 6.4.20 C-Flex Pump Company
- 6.4.21 Allweiler GmbH (CIRCOR Intl.)
- 6.4.22 Atlas Copco AB (Varisco PCP line)
- 6.4.23 Graco Inc.
- 6.4.24 NETCO Pumps & Equipment Pty Ltd
- 6.4.25 BBP Pumps BV
- 6.4.26 Shanley Pump & Equipment, Inc.
7 MARKET OPPORTUNITIES AND FUTURE OUTLOOK
- 7.1 White-space and Unmet-Need Assessment

