PUBLISHER: Mordor Intelligence | PRODUCT CODE: 2123799

PUBLISHER: Mordor Intelligence | PRODUCT CODE: 2123799
Electric Commercial Vehicle - Market Share Analysis, Industry Trends & Statistics, Growth Forecasts (2026 - 2031)
According to Mordor Intelligence, the electric commercial vehicle market size is expected to increase from USD 79.21 billion in 2025 to USD 88.30 billion in 2026 and reach USD 166.30 billion by 2031, growing at a CAGR of 13.5% over 2026-2031.
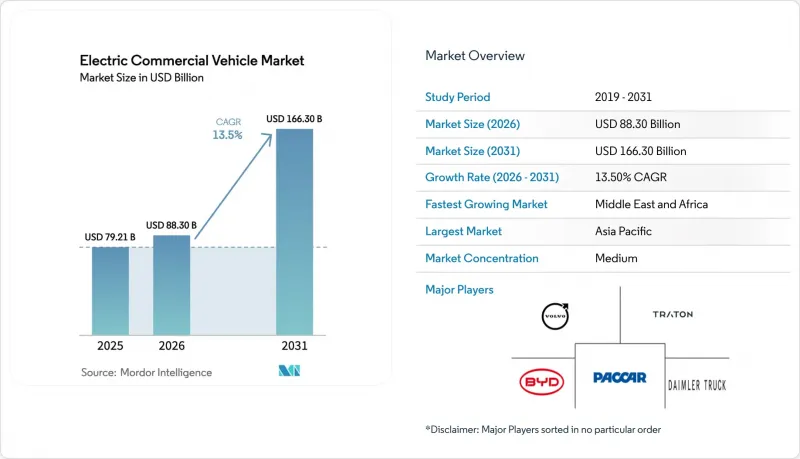
This report is Segmented by Vehicle Type (Bus, Trucks, and More), Propulsion (Battery Electric Vehicles, Hybrid Electric Vehicles, and More), Power Output (Less Than 150 KW, 150-250 KW, and More), Battery Capacity (Less Than 100 KWh, 100-200 KWh, and More), Range, End-Use Industry, Charging Type, and Geography. The Market Forecasts are Provided in Terms of Value (USD) and Volume (Units).
Global Electric Commercial Vehicle Market Trends and Insights
Rapid Battery-Cost Decline Below USD 100/kWh Driving TCO Breakeven
In early 2025, lithium-iron-phosphate cell prices reached a significant milestone, crossing the breakeven threshold for high-mileage trucks. CATL's latest-generation cells offer enhanced energy density and cost efficiency, enabling extended ranges without exceeding axle-weight limits. When considering fuel and maintenance savings, Daimler Trucks' eCascadia demonstrates a notable cost advantage over diesel alternatives on regional routes in California. Reflecting a shift in market dynamics, PACCAR reported that a substantial portion of its 2025 orders were placed without relying on subsidies, highlighting the growing economic feasibility of these technologies. Projections suggest further cost reductions in the coming years, potentially eliminating the need for purchase incentives across most operational scenarios.
Government-funded Zero-Emission Fleet Procurement Mandates
The European Commission's revised heavy-duty CO2 standards stipulate a 45% cut by 2030 and a 90% cut by 2040, effectively sunsetting new diesel in medium-duty classes. China's dual-credit scheme rewards over-compliance, prompting BYD to attribute a significant share of its 2025 domestic commercial sales to the incentive framework. India's FAME-III allocates substantial funding to electric buses and charging infrastructure, with a particular focus on Delhi, Mumbai, and Bengaluru. Such programs spur bulk procurement, accelerate learning curves, and tighten supply chains faster than organic demand growth alone.
Commercial-grade Fast-Charger Grid Constraints on Highway Freight Corridors
The United States operates a limited number of heavy-duty DC chargers above 350 kW, falling short of corridor requirements. In Europe, interconnection queues are significantly long, delaying site energization and pushing fleets onto regional routes. Electrify America notes that a significant portion of its planned truck sites require substation upgrades, each of which entails substantial costs. Meanwhile, India's National Highways Authority has activated only a fraction of its planned truck-charging plazas, with full commissioning now delayed. These grid bottlenecks hinder the potential for long-haul battery-electric penetration until megawatt charging becomes more prevalent.
Other drivers and restraints analyzed in the detailed report include:
- E-commerce-led Surge in Urban Last-Mile Delivery Vehicles
- Hydrogen Hub Investments Accelerating Fuel-cell Trucks
- Payload Penalties from Large Battery Packs in Long-haul Segments
For complete list of drivers and restraints, kindly check the Table Of Contents.
Segment Analysis
Buses accounted for 54.12% of 2025 revenue, reflecting long procurement cycles and public subsidies that favor fleet-wide deployment in city transit systems, giving the electric commercial vehicle market size a bus-centred foundation. Trucks, however, are growing at 17.15% CAGR through 2031 as e-commerce giants electrify last-mile and regional routes. In recent years, BYD has delivered a significant number of electric buses globally, with the majority allocated to Chinese municipalities due to air-quality mandates. Meanwhile, Ford has experienced notable growth in the sales of its E-Transit vans across North America. While payload penalties hinder the adoption of battery-electric vehicles in long-haul heavy trucks, they steer near-term growth toward regional hauls within a limited radius. Vans, benefiting from modular battery packaging that maintains cargo volume, have become essential for parcel carriers. Notably, DHL's Streetscooter fleet has expanded substantially in recent years.
Continued municipal funding sustains bus dominance in emerging markets, yet the shorter four- to six-year replacement cycles in logistics fleets position trucks to overtake buses in annual volumes after 2028. Fleet operators such as UPS, Amazon, and JD Logistics are creating a secondary market for lightweight electric chassis, expanding supplier diversity beyond traditional bus-focused OEMs. Meanwhile, waste-management authorities and utilities adopt specialized electric chassis for stop-and-go duty cycles, further broadening truck demand. As supply chains mature and chassis versatility improves, trucks are set to become the volume engine of the electric commercial vehicle market, particularly in high-utilization parcel and municipal service routes.
Battery electric powertrains captured an 82.36% share in 2025, benefiting from mature supply chains and the rapid decline in cell pricing, giving the electric commercial vehicle market a clear technology incumbent. Fuel-cell electric vehicles nonetheless post a 25.01% CAGR through 2031, targeting heavy-duty use cases where battery mass erodes payload economics. Hyundai's XCIENT trucks have clocked more than 5 million kilometers with refueling, validating the business case for hydrogen in long-haul applications. The United States hydrogen hub program earmarks 1,000 fuel-cell trucks for California ports by 2028, signaling public-sector confidence in the pathway. Plug-in hybrids serve range-constrained regions; Volvo's plug-in FH variant made up a nominal share of its European electric sales in 2024.
Battery-electric traction will remain dominant in urban and regional fleets because depot charging and low energy prices preserve its cost advantage. Fuel-cell adoption depends on achieving cost competitiveness for hydrogen, which is expected as renewable electrolysis scales in the coming years. As regulators enforce stricter zero-emission standards, hybrid and non-plug-in variants are likely to decline. In the shifting propulsion landscape, batteries are expected to dominate urban routes. At the same time, hydrogen is poised to serve heavier, long-distance freight, expanding the market for electric commercial vehicles.
The 150-250 kW band held 46.25% of 2025 deliveries, aligning with Class 6-7 trucks used for regional distribution. Greater-than-250 kW drivetrains grow at 15.23% CAGR to 2031, catalyzed by Daimler's eActros 600 and Tesla's Semi, both of which eliminate range anxiety on major freight corridors. Less-than-150 kW systems dominate light vans such as Rivian's EDV, where lower power improves affordability and efficiency.
High-power systems require 800-volt architectures that add 15-20% component cost yet enable one-megawatt charging, a critical feature for class 8 tractors. As megawatt infrastructure spreads across Interstate 5, Interstate 95, and European TEN-T corridors, high-power segments will capture a larger slice of the electric commercial vehicle market. Mid-range power will remain prevalent in municipal and regional fleets, where overnight depot charging is sufficient.
Complete Report Scope:
- By Vehicle Type
- Bus
- Trucks
- Pick-up Trucks
- Vans
- By Propulsion
- Battery Electric Vehicles (BEV)
- Hybrid Electric Vehicles (HEV)
- Plug-in Hybrid Electric Vehicles (PHEV)
- Fuel-cell Electric Vehicles (FCEV)
- By Power Output
- Less than 150 kW
- 150-250 kW
- Greater than 250 kW
- By Battery Capacity
- Less than 100 kWh
- 100-200 kWh
- Greater than 200 kWh
- By Range
- Less than 150 miles
- 150-300 miles
- More than 300 miles
- By End-use Industry
- Urban Transit
- Logistics and Delivery
- Waste Management
- Utilities and Construction
- By Charging Type
- Depot (AC)
- Opportunity / En-route (DC)
- By Geography
- North America
- United States
- Canada
- Rest of North America
- South America
- Brazil
- Argentina
- Rest of South America
- Europe
- Germany
- United Kingdom
- France
- Italy
- Spain
- Nordics
- Rest of Europe
- Asia-Pacific
- China
- India
- Japan
- South Korea
- Rest of Asia-Pacific
- Middle East and Africa
- United Arab Emirates
- Saudi Arabia
- Turkey
- Egypt
- South Africa
- Rest of Middle East and Africa
- North America
Geography Analysis
Asia-Pacific controlled 62.18% of 2025 revenue, underpinned by China's significant electric share of new urban bus orders and India's FAME-III subsidy for buses and goods carriers. Japan's Isuzu and Mitsubishi Fuso delivered several electric trucks focused on Tokyo and Osaka's low-emission zones. South Korea exported XCIENT fuel-cell trucks, sharpening domestic hydrogen expertise. The region benefits from centralized procurement, dense urbanization, and air-quality imperatives that accelerate public bus rollouts.
The Middle East and Africa region is expected to record the fastest growth, with a 14.18% CAGR by 2031. Under Vision 2030, Saudi Arabia's Public Investment Fund has allocated significant resources to establish electric bus and truck plants, aiming for substantial annual production in the coming years. Durban financed several e-buses through the African Development Bank, while Egypt aims to electrify a significant number of Cairo buses by 2028 with EBRD loans. Growth rides on sovereign capital and multilateral facilities in markets that lack domestic OEM depth but possess ambitious decarbonization agendas.
North America and Europe mirror each other in regulatory stringency and infrastructure challenges. California's Advanced Clean Trucks (ACT) regulation requires manufacturers to sell ZEVs as an increasing share of annual sales starting MY2024, reaching 55% (Class 2b-3), 75% (Class 4-8 straight trucks), and 40% (tractors) by MY2035. Canada set aside CAD 2.75 billion (~USD 2 billion) to electrify 5,000 buses by 2026-27. Europe's 45% heavy-duty CO2 cut by 2030 is reinforced by German truck subsidies and expanding low-emission zones in France and the United Kingdom. Both continents face grid connection delays along highway corridors, slowing long-haul penetration, yet policy certainty and purchase incentives keep uptake on track for a rapid climb through 2030.
- BYD Auto Co., Ltd.
- Daimler Truck AG
- AB Volvo
- Traton SE
- Zhengzhou Yutong Bus Co., Ltd
- Ford Motor Company
- Tesla Inc.
- Proterra Inc.
- Rivian Automotive Inc.
- Tata Motors Limited
- Olectra Greentech Limited
- PACCAR Inc.
- Nikola Corporation
- NFI Group Inc. (New Flyer)
- Hyundai Motor Company
- Isuzu Motors Limited
- Mitsubishi Fuso Truck & Bus Corporation
Additional Benefits:
- The market estimate (ME) sheet in Excel format
- 3 months of analyst support
TABLE OF CONTENTS
1 Introduction
- 1.1 Study Assumptions & Market Definition
- 1.2 Scope of the Study
2 Research Methodology
3 Executive Summary
4 Market Landscape
- 4.1 Market Overview
- 4.2 Market Drivers
- 4.2.1 Rapid Battery-Cost Decline Below USD 100/kWh Driving TCO Breakeven
- 4.2.2 Government-funded Zero-Emission Fleet Procurement Mandates
- 4.2.3 E-commerce-led Surge in Urban Last-Mile Delivery Vehicles
- 4.2.4 Hydrogen Hub Investments Accelerating Fuel-cell Trucks
- 4.2.5 Dedicated E-Bus Financing Programs by Multilateral Agencies
- 4.2.6 Municipal Anti-Noise Regulations Boosting Night-time e-Freight Adoption
- 4.3 Market Restraints
- 4.3.1 Commercial-grade Fast-Charger Grid Constraints on Highway Freight Corridors
- 4.3.2 Payload Penalties from Large Battery Packs in Long-haul Segments
- 4.3.3 Limited Residual-Value Benchmarking for Used e-Trucks
- 4.3.4 Scarcity of Trained Technicians for High-Voltage Drivetrains in Emerging Markets
- 4.4 Supply-Chain Analysis
- 4.5 Regulatory or Technological Outlook
- 4.6 Porter's Five Forces
- 4.6.1 Threat of New Entrants
- 4.6.2 Bargaining Power of Buyers
- 4.6.3 Bargaining Power of Suppliers
- 4.6.4 Threat of Substitutes
- 4.6.5 Intensity of Competitive Rivalry
- 4.7 Electric Vehicle Charging Infrastructure Development Across the Region
5 Market Size & Growth Forecasts (Value (USD) and Volume (Units))
- 5.1 By Vehicle Type
- 5.1.1 Bus
- 5.1.2 Trucks
- 5.1.3 Pick-up Trucks
- 5.1.4 Vans
- 5.2 By Propulsion
- 5.2.1 Battery Electric Vehicles (BEV)
- 5.2.2 Hybrid Electric Vehicles (HEV)
- 5.2.3 Plug-in Hybrid Electric Vehicles (PHEV)
- 5.2.4 Fuel-cell Electric Vehicles (FCEV)
- 5.3 By Power Output
- 5.3.1 Less than 150 kW
- 5.3.2 150-250 kW
- 5.3.3 Greater than 250 kW
- 5.4 By Battery Capacity
- 5.4.1 Less than 100 kWh
- 5.4.2 100-200 kWh
- 5.4.3 Greater than 200 kWh
- 5.5 By Range
- 5.5.1 Less than 150 miles
- 5.5.2 150-300 miles
- 5.5.3 More than 300 miles
- 5.6 By End-use Industry
- 5.6.1 Urban Transit
- 5.6.2 Logistics and Delivery
- 5.6.3 Waste Management
- 5.6.4 Utilities and Construction
- 5.7 By Charging Type
- 5.7.1 Depot (AC)
- 5.7.2 Opportunity / En-route (DC)
- 5.8 By Geography
- 5.8.1 North America
- 5.8.1.1 United States
- 5.8.1.2 Canada
- 5.8.1.3 Rest of North America
- 5.8.2 South America
- 5.8.2.1 Brazil
- 5.8.2.2 Argentina
- 5.8.2.3 Rest of South America
- 5.8.3 Europe
- 5.8.3.1 Germany
- 5.8.3.2 United Kingdom
- 5.8.3.3 France
- 5.8.3.4 Italy
- 5.8.3.5 Spain
- 5.8.3.6 Nordics
- 5.8.3.7 Rest of Europe
- 5.8.4 Asia-Pacific
- 5.8.4.1 China
- 5.8.4.2 India
- 5.8.4.3 Japan
- 5.8.4.4 South Korea
- 5.8.4.5 Rest of Asia-Pacific
- 5.8.5 Middle East and Africa
- 5.8.5.1 United Arab Emirates
- 5.8.5.2 Saudi Arabia
- 5.8.5.3 Turkey
- 5.8.5.4 Egypt
- 5.8.5.5 South Africa
- 5.8.5.6 Rest of Middle East and Africa
- 5.8.1 North America
6 Competitive Landscape
- 6.1 Market Concentration
- 6.2 Strategic Moves
- 6.3 Market Share Analysis
- 6.4 Company Profiles (Includes Global Level Overview, Market Level Overview, Core Segments, Financials as Available, Strategic Information, Market Rank/Share for Key Companies, Products and Services, SWOT Analysis, and Recent Developments)
- 6.4.1 BYD Auto Co., Ltd.
- 6.4.2 Daimler Truck AG
- 6.4.3 AB Volvo
- 6.4.4 Traton SE
- 6.4.5 Zhengzhou Yutong Bus Co., Ltd
- 6.4.6 Ford Motor Company
- 6.4.7 Tesla Inc.
- 6.4.8 Proterra Inc.
- 6.4.9 Rivian Automotive Inc.
- 6.4.10 Tata Motors Limited
- 6.4.11 Olectra Greentech Limited
- 6.4.12 PACCAR Inc.
- 6.4.13 Nikola Corporation
- 6.4.14 NFI Group Inc. (New Flyer)
- 6.4.15 Hyundai Motor Company
- 6.4.16 Isuzu Motors Limited
- 6.4.17 Mitsubishi Fuso Truck & Bus Corporation
7 Market Opportunities & Future Outlook
- 7.1 White-space & Unmet-need Assessment

