PUBLISHER: Mordor Intelligence | PRODUCT CODE: 2123978

PUBLISHER: Mordor Intelligence | PRODUCT CODE: 2123978
Ethylene Carbonate - Market Share Analysis, Industry Trends & Statistics, Growth Forecasts (2026 - 2031)
According to Mordor Intelligence, the ethylene carbonate market size is expected to grow from USD 1.13 billion in 2025 to USD 1.23 billion in 2026 and is forecast to reach USD 1.91 billion by 2031 at 9.12% CAGR over 2026-2031.
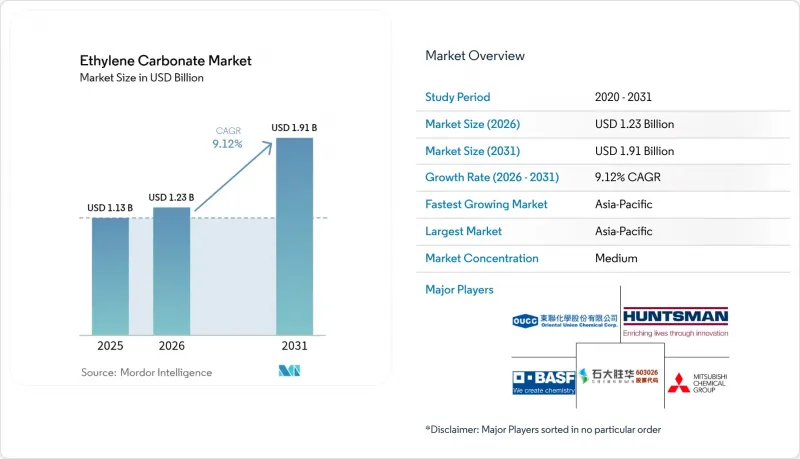
This report is Segmented by Form (Solid, Liquid), Application (Lithium-Ion Batteries, Lubricants, Medical Products, Intermediates and Agents, Other Applications), End-User Industry (Automotive, Pharmaceuticals, Oil and Gas, Other End-User Industries), and Geography (Asia-Pacific, North America, Europe, South America, Middle East and Africa). The Market Forecasts are Provided in Terms of Value (USD).
Global Ethylene Carbonate Market Trends and Insights
Surging Demand for High-Energy-Density Li-ion Batteries in EVs
Global electric-vehicle rollouts require electrolyte systems that sustain cell voltages above 4.4 V while enabling fast-charge performance. Ethylene carbonate forms a stable SEI layer that protects graphite anodes from solvent co-intercalation, a property validated in Skoltech research showing markedly lower capacity fade versus propylene carbonate alternatives. Automakers and cell makers therefore embed long-term offtake clauses into supply contracts, shielding demand from short-term price swings. The cumulative effect adds 3.20 percentage points to the forecast CAGR as battery deployments scale across passenger cars, commercial fleets, and stationary storage.
Growth in Premium Industrial & Automotive Lubricants
High-performance lubricants in metal-working, engine oils, and wind-turbine gearboxes increasingly specify polar carbonate additives that maintain viscosity at temperatures above 200 °C. Laboratory data on oleochemical carbonates confirm that the short carbon chain of ethylene carbonate confers superior solubility and film-forming properties, enhancing extreme-pressure resistance. OEM warranty extensions to 20,000 km oil-change intervals amplify additive loading per formulation, translating into steady, margin-accretive demand beyond the battery sector.
Volatility in Ethylene-Oxide Feedstock Prices
Feedstock costs constitute a significant portion of variable production costs for non-integrated manufacturers. A substantial share of global ethylene capacity is at risk of closure during the current market downturn, intensifying price volatility and reducing carbonate converters' profit margins. Producers with captive ethylene-oxide units hedge exposure, but merchants supplying smaller downstream players experience margin whiplash, dragging the sector CAGR by 2.10 percentage points.
Other drivers and restraints analyzed in the detailed report include:
- Expansion of Asian Battery-Manufacturing Capacity
- Emergence of Solid-State Battery Precursor Requirements
- Substitution by Dimethyl & Propylene Carbonate Blends
For complete list of drivers and restraints, kindly check the Table Of Contents.
Segment Analysis
The solid segment retained leadership with 51.60% revenue in 2025, supported by a decades-old logistics network that ships greater than or equal to 99% purity flakes worldwide for on-site dissolution. Liquid battery-grade solutions, however, are expanding at a 9.55% CAGR to 2031 because they arrive moisture-controlled and filtered to less than 20 ppm water, eliminating in-plant handling steps that risk contamination. This structural pivot lets suppliers capture processing spreads while enabling automated filling in gigafactory electrolyte lines. Solid products will remain relevant for bulk industrial uses where drum or bag handling is not rate-limiting, preserving a sizeable, slow-growing base.
The performance gap between 99.0% technical-grade solids and 99.7% battery-grade liquids is narrowing as crystallization and ion-exchange polishing are embedded upstream, raising the addressable share of liquids in non-battery segments. US-based Huntsman's recent investment in a Texan E-GRADE purification line exemplifies how Western suppliers defend market share with higher-purity, value-added volumes. Asian competitors counter with bulk ISO-tank shipments that cut freight costs by 10-12%, intensifying form-factor competition through 2031.
Complete Report Scope:
- By Form
- Solid (greater than or equal to 99% purity flakes)
- Liquid (battery-grade solution)
- By Application
- Lithium-ion Batteries
- Lubricants
- Medical Products
- Intermediates and Agents
- Other Applications
- By End-user Industry
- Automotive
- Pharmaceuticals
- Oil and Gas
- Other End-user Industries
- By Geography
- Asia-Pacific
- China
- Japan
- India
- South Korea
- Rest of Asia-Pacific
- North America
- United States
- Canada
- Mexico
- Europe
- Germany
- United Kingdom
- France
- Italy
- Russia
- Rest of Europe
- South America
- Brazil
- Argentina
- Rest of South America
- Middle East and Africa
- Saudi Arabia
- South Africa
- Rest of Middle East and Africa
- Asia-Pacific
Geography Analysis
Asia-Pacific's integrated chemical-to-battery corridor yielded 54.05% of global revenues in 2025 and is expected to clock a 9.48% CAGR to 2031, buoyed by 26 million t of planned ethylene cracker capacity in mainland China that underpins cost leadership. Local carbonate producers typically site plants near gigafactories, shaving 2-3 days off transit times and embedding on-call quality-assurance labs that align with automotive traceability protocols. Japan's ethylene output hit a 35-year low in 2024, reflecting a shift toward high-value specialty chemicals even as domestic battery projects grow, which widens China's regional production advantage.
North America remains structurally short in battery-grade carbonate despite Huntsman's position as the largest domestic supplier. The Inflation Reduction Act's incentives for US cell factories have triggered multi-year offtake agreements that partially hedge trans-Pacific supply risks. Feedstock costs, however, are higher because shale-gas-advantaged ethane crackers prioritize polyethylene, requiring carbonate makers to secure ethylene oxide at index-linked premiums.
Europe's stringent REACH environment raises compliance costs yet secures a premium for fully documented material. BASF's pledge to power six US care-chemical sites entirely with renewable electricity underscores how sustainability credentials are being deployed globally as soft differentiators in mature markets. Meanwhile, Middle East & Africa and South America collectively account for smaller share of volume but present upside through petrochemical diversification programs and growing EV import penetration. Logistics flexibility-using ISO tanks and regional stocking hubs-remains the route to profitable share capture in these emerging destinations.
- BASF SE
- Guangzhou Tinci Materials Technology Co., Ltd.
- Huntsman International LLC
- Liaoning Honggang Chemical Co., Ltd.
- Merck KGaA
- Mitsubishi Chemical Group Corporation
- OUCC
- Shandong Lixing Advanced Material Co., Ltd.
- Shandong Senjie Cleantech Co.,Ltd.
- Shenzhen Xinzhoubang Technology Co., Ltd.
- Shida Shenghua New Materials Group Co., Ltd.
- TOAGOSEI CO.,LTD.
- ZIBO DONGHAI INDUSTRIES CO.,LTD.
Additional Benefits:
- The market estimate (ME) sheet in Excel format
- 3 months of analyst support
TABLE OF CONTENTS
1 Introduction
- 1.1 Study Assumptions and Market Definition
- 1.2 Scope of the Study
2 Research Methodology
3 Executive Summary
4 Market Landscape
- 4.1 Market Overview
- 4.2 Market Drivers
- 4.2.1 Surging demand for high-energy-density Li-ion batteries in EVs
- 4.2.2 Growth in premium industrial and automotive lubricants
- 4.2.3 Expansion of Asian battery-manufacturing capacity
- 4.2.4 Favourable regulations for safer electrolyte solvents
- 4.2.5 Emergence of solid-state battery precursor requirements
- 4.3 Market Restraints
- 4.3.1 Health and environmental toxicity classification of EC
- 4.3.2 Volatility in ethylene-oxide feedstock prices
- 4.3.3 Substitution by dimethyl and propylene carbonate blends
- 4.4 Value Chain Analysis
- 4.5 Porter's Five Forces Analysis
- 4.5.1 Bargaining Power of Suppliers
- 4.5.2 Bargaining Power of Buyers
- 4.5.3 Threat of New Entrants
- 4.5.4 Threat of Substitute Products and Services
- 4.5.5 Degree of Competition
5 Market Size and Growth Forecasts (Value)
- 5.1 By Form
- 5.1.1 Solid (greater than or equal to 99% purity flakes)
- 5.1.2 Liquid (battery-grade solution)
- 5.2 By Application
- 5.2.1 Lithium-ion Batteries
- 5.2.2 Lubricants
- 5.2.3 Medical Products
- 5.2.4 Intermediates and Agents
- 5.2.5 Other Applications
- 5.3 By End-user Industry
- 5.3.1 Automotive
- 5.3.2 Pharmaceuticals
- 5.3.3 Oil and Gas
- 5.3.4 Other End-user Industries
- 5.4 By Geography
- 5.4.1 Asia-Pacific
- 5.4.1.1 China
- 5.4.1.2 Japan
- 5.4.1.3 India
- 5.4.1.4 South Korea
- 5.4.1.5 Rest of Asia-Pacific
- 5.4.2 North America
- 5.4.2.1 United States
- 5.4.2.2 Canada
- 5.4.2.3 Mexico
- 5.4.3 Europe
- 5.4.3.1 Germany
- 5.4.3.2 United Kingdom
- 5.4.3.3 France
- 5.4.3.4 Italy
- 5.4.3.5 Russia
- 5.4.3.6 Rest of Europe
- 5.4.4 South America
- 5.4.4.1 Brazil
- 5.4.4.2 Argentina
- 5.4.4.3 Rest of South America
- 5.4.5 Middle East and Africa
- 5.4.5.1 Saudi Arabia
- 5.4.5.2 South Africa
- 5.4.5.3 Rest of Middle East and Africa
- 5.4.1 Asia-Pacific
6 Competitive Landscape
- 6.1 Market Concentration
- 6.2 Strategic Moves
- 6.3 Market Share(%)/Ranking Analysis
- 6.4 Company Profiles (includes Global level Overview, Market level overview, Core Segments, Financials as available, Strategic Information, Market Rank/Share for key companies, Products and Services, and Recent Developments)
- 6.4.1 BASF SE
- 6.4.2 Guangzhou Tinci Materials Technology Co., Ltd.
- 6.4.3 Huntsman International LLC
- 6.4.4 Liaoning Honggang Chemical Co., Ltd.
- 6.4.5 Merck KGaA
- 6.4.6 Mitsubishi Chemical Group Corporation
- 6.4.7 OUCC
- 6.4.8 Shandong Lixing Advanced Material Co., Ltd.
- 6.4.9 Shandong Senjie Cleantech Co.,Ltd.
- 6.4.10 Shenzhen Xinzhoubang Technology Co., Ltd.
- 6.4.11 Shida Shenghua New Materials Group Co., Ltd.
- 6.4.12 TOAGOSEI CO.,LTD.
- 6.4.13 ZIBO DONGHAI INDUSTRIES CO.,LTD.
7 Market Opportunities and Future Outlook
- 7.1 White-space and Unmet-need Assessment

