PUBLISHER: Mordor Intelligence | PRODUCT CODE: 2123991

PUBLISHER: Mordor Intelligence | PRODUCT CODE: 2123991
IoT Insurance - Market Share Analysis, Industry Trends & Statistics, Growth Forecasts (2026 - 2031)
According to Mordor Intelligence, the IoT insurance market size was valued at USD 52.78 billion in 2025 and estimated to grow from USD 68.27 billion in 2026 to reach USD 247.58 billion by 2031, at a CAGR of 29.40% during the forecast period (2026-2031).
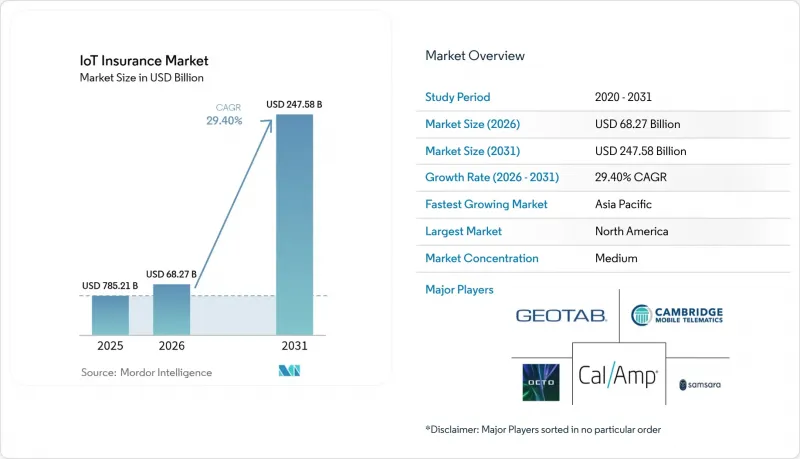
This report is Segmented by Deployment Model (Cloud and On-Premise), Insurance Line (Property and Casualty, Life, and More), Iot Technology Type (Vehicle Telematics, Smart-Home Sensors, Wearables and Health Devices, and More), End-User Industry (Retail and Commercial, Residential, Automotive, Industrial, and More), and Geography. The Market Forecasts are Provided in Terms of Value (USD).
Global IoT Insurance Market Trends and Insights
Proliferation of Usage-Based Insurance (UBI)
Telematics-enabled UBI is redefining personal and commercial auto premiums as real-time driver behavior replaces static demographic factors. Progressive wrote USD 6.684 billion in net premiums during February 2025, a 17% year-over-year rise driven chiefly by telematics policies that now represent 18% of its book. Fleet operators replicate those gains; a luxury transport provider cut insurance spend by 15% after implementing Samsara's connected-operations suite, confirming enterprise appetite for granular behavioral scoring. AI-driven pattern recognition further predicts collision-prone maneuvers, enabling proactive coaching that lowers claims frequency and ultimately reduces loss ratios for carriers.
Adoption of Smart-Home and Industrial Sensors
Water escape, fire, and equipment failure account for a majority of property and industrial losses; low-cost sensors address these pain points by alerting users and insurers before damage escalates. State Farm has shipped 2 million Ting electrical-fire sensors, reporting an 80% reduction in related claims across 700,000 connected homes. In commercial settings, HSB's Relayr analytics suite lifts revenue for elevator maintenance partners by 12% through predictive servicing that prevents business interruption. Insurers match these preventive gains with premium discounts ranging from 5% to 20% to encourage wider device adoption.
Data-Privacy and Cybersecurity Exposure
A global IT outage in July 2024 struck 8.5 million systems and inflicted USD 10-15 billion in economic loss, underscoring the systemic risk of interconnected devices. Zurich lists cyber threats among the top five risks facing electronics manufacturers, warning that compromised firmware can trigger cascading losses for both carriers and insureds. Compliance with Europe's forthcoming Cyber Resilience Act can cost non-conforming vendors up to EUR 15 million in penalties, creating adoption friction yet offering a competitive moat for firms that build secure architectures upfront.
Other drivers and restraints analyzed in the detailed report include:
- Rapid Fall in IoT Hardware and Connectivity Costs
- Regulatory Push for Data-Driven Pricing
- Legacy-Core Integration Complexity
For complete list of drivers and restraints, kindly check the Table Of Contents.
Segment Analysis
Cloud environments control 63.20% of the IoT insurance market and will expand at a 30.70% CAGR, lifting the IoT insurance market size for cloud platforms to USD 166.31 billion by 2031. Elastic compute, API openness, and managed security patches free carriers from maintaining capital-intensive data centers. Samsara's connected-operations cloud reached USD 1.458 billion in ARR in Q4 2025, illustrating how scalable telemetry architectures translate into enterprise adoption.
On-premise deployments persist in heavily regulated jurisdictions or where data sovereignty statutes prohibit offshore processing. Even so, security certifications such as FedRAMP High and ISO 27018 have reduced the perceived risk of multi-tenant clouds, prompting phased migration away from local servers. Edge nodes are increasingly integrated into cloud stacks, ensuring ultra-low latency for autonomous vehicle coverage while central analytics refine pricing algorithms. As hybrid models mature, carriers gain situational flexibility without compromising centralized actuarial oversight.
Property and Casualty lines hold 47.80% of 2025 revenue, representing the largest IoT insurance market size by product class. Smart-home and industrial sensors deliver tangible loss-avoidance, making P&C a natural first adopter. However, life underwriters are growing at 33.20% CAGR; they leverage continuous wearable data to refine mortality assumptions and incentivize healthy behavior through dynamic premiums.
Commercial lines increasingly embed industrial IoT into workers' compensation, where predictive maintenance lowers injury frequency. The shift from retrospective claims adjustment to preventive analytics compresses combined ratios and appeals to reinsurers seeking demonstrable portfolio telemetry. Longer term, cross-line bundling-such as combining life, auto, and home policies around a single sensor suite-will blur historic product boundaries and reward data-centric platforms.
Complete Report Scope:
- By Deployment Model
- Cloud
- On-Premise
- By Insurance Line
- Property and Casualty
- Life
- Health
- Commercial Lines
- By IoT Technology Type
- Vehicle Telematics
- Smart-Home Sensors
- Wearables and Health Devices
- Industrial IoT Gateways
- Environmental and Parametric Sensors
- By End-user Industry
- Retail and Commercial
- Residential (Smart-homes)
- Automotive
- Industrial
- Healthcare
- Public Infrastructure
- Logistics and Navigation
- Other End-user Industries
- By Geography
- North America
- United States
- Canada
- Mexico
- South America
- Brazil
- Argentina
- Chile
- Rest of South America
- Europe
- Germany
- United Kingdom
- France
- Italy
- Spain
- Russia
- Rest of Europe
- Asia-Pacific
- China
- India
- Japan
- South Korea
- Singapore
- Malaysia
- Australia
- Rest of Asia-Pacific
- Middle East and Africa
- Middle East
- United Arab Emirates
- Saudi Arabia
- Turkey
- Rest of Middle East
- Africa
- South Africa
- Nigeria
- Egypt
- Rest of Africa
- Middle East
- North America
Geography Analysis
North America's 37.20% revenue share in 2025 derives from well-established telematics regulations and widespread consumer acceptance. State Farm's mass deployment of Ting sensors and Progressive's 18% policy-in-force growth illustrate a broad shift toward sensor-mediated value propositions. Canadian regulators are tailoring AIDA and CPPA privacy laws to balance innovation with consumer sovereignty, fostering gradual yet steady device uptake.
Europe experiences cohesive growth through the EU Data Act and forthcoming Cyber Resilience Act, which standardize device security and data sharing across 27 member states. EIOPA notes that 17% of carriers already offer motor insurance linked to IoT and expects penetration to climb as compliance frameworks build consumer confidence. Germany, France, and the United Kingdom spearhead adoption, while newer EU members benefit from cohesion funds that expand broadband coverage required for massive IoT roll-outs.
Asia-Pacific records a 33.00% CAGR, driven by India's FDI ceiling lift to 100% that invites multinational capital, and China's NFRA guidelines that delineate AI and data-governance rules. Australian and New Zealand fleets will rise from 1.6 million telematics units in 2023 to 2.7 million by 2028, cementing regional auto dominance. Japan pursues incremental generative-AI pilots within insurers like Mitsui Sumitomo to complement meticulous risk cultures, thereby avoiding abrupt operational shifts.
Latin America and the Middle East and Africa remain nascent yet promising. Mexico's improving 5G coverage and Brazil's open-insurance regime are expected to shorten the adoption lag. Gulf Cooperation Council countries invest in smart-city megaprojects where embedded sensor grids naturally dovetail with commercial IoT coverage for infrastructure, property, and cyber lines.
- Octo Telematics S.p.A.
- Cambridge Mobile Telematics, Inc.
- Geotab Inc.
- CalAmp Corp.
- Samsara Inc.
- Trak Global Group Ltd
- Zubie, Inc.
- Mojio Inc.
- Queclink Wireless Solutions Co. Ltd
- Telit Cinterion PLC
- Sensata Technologies Holding plc
- Laird Connectivity LLC
- Kuantum Pvt Ltd (Kruzr)
- Smart Things Lab Co. Ltd
- Roost Inc.
- Notion (fka Iris Inc.)
- Eddy Solutions Inc.
- HSB ("Sensor Solutions by HSB")
- ThingCo Global Ltd
- LexisNexis Risk Solutions Group
- Flow Insurance Ltd
- Kinsa Inc.
- Metromile Enterprise Solutions
- Safehub, Inc.
- Parsyl, Inc.
Additional Benefits:
- The market estimate (ME) sheet in Excel format
- 3 months of analyst support
TABLE OF CONTENTS
1 INTRODUCTION
- 1.1 Study Assumptions and Market Definition
- 1.2 Scope of the Study
2 RESEARCH METHODOLOGY
3 EXECUTIVE SUMMARY
4 MARKET LANDSCAPE
- 4.1 Market Overview
- 4.2 Market Drivers
- 4.2.1 Proliferation of usage-based insurance (UBI)
- 4.2.2 Adoption of smart-home and industrial sensors
- 4.2.3 Rapid fall in IoT hardware and data-connectivity costs
- 4.2.4 Regulatory push for data-driven premium pricing
- 4.2.5 Emergence of parametric, trigger-based P and C products
- 4.2.6 Reinsurers' demand for continuous portfolio telemetry
- 4.3 Market Restraints
- 4.3.1 Data-privacy and cybersecurity exposure
- 4.3.2 Legacy-core integration complexity
- 4.3.3 Sensor-data reliability and calibration drift
- 4.3.4 Antitrust scrutiny on OEM-insurer data exchange
- 4.4 Industry Value Chain Analysis
- 4.5 Regulatory Landscape
- 4.6 Technological Outlook
- 4.7 Industry Attractiveness - Porter's Five Forces Analysis
- 4.7.1 Bargaining Power of Suppliers
- 4.7.2 Bargaining Power of Buyers
- 4.7.3 Threat of New Entrants
- 4.7.4 Threat of Substitutes
- 4.7.5 Intensity of Competitive Rivalry
- 4.8 Impact of Macroeconomic Factors on the Market
5 MARKET SIZE AND GROWTH FORECASTS (VALUES)
- 5.1 By Deployment Model
- 5.1.1 Cloud
- 5.1.2 On-Premise
- 5.2 By Insurance Line
- 5.2.1 Property and Casualty
- 5.2.2 Life
- 5.2.3 Health
- 5.2.4 Commercial Lines
- 5.3 By IoT Technology Type
- 5.3.1 Vehicle Telematics
- 5.3.2 Smart-Home Sensors
- 5.3.3 Wearables and Health Devices
- 5.3.4 Industrial IoT Gateways
- 5.3.5 Environmental and Parametric Sensors
- 5.4 By End-user Industry
- 5.4.1 Retail and Commercial
- 5.4.2 Residential (Smart-homes)
- 5.4.3 Automotive
- 5.4.4 Industrial
- 5.4.5 Healthcare
- 5.4.6 Public Infrastructure
- 5.4.7 Logistics and Navigation
- 5.4.8 Other End-user Industries
- 5.5 By Geography
- 5.5.1 North America
- 5.5.1.1 United States
- 5.5.1.2 Canada
- 5.5.1.3 Mexico
- 5.5.2 South America
- 5.5.2.1 Brazil
- 5.5.2.2 Argentina
- 5.5.2.3 Chile
- 5.5.2.4 Rest of South America
- 5.5.3 Europe
- 5.5.3.1 Germany
- 5.5.3.2 United Kingdom
- 5.5.3.3 France
- 5.5.3.4 Italy
- 5.5.3.5 Spain
- 5.5.3.6 Russia
- 5.5.3.7 Rest of Europe
- 5.5.4 Asia-Pacific
- 5.5.4.1 China
- 5.5.4.2 India
- 5.5.4.3 Japan
- 5.5.4.4 South Korea
- 5.5.4.5 Singapore
- 5.5.4.6 Malaysia
- 5.5.4.7 Australia
- 5.5.4.8 Rest of Asia-Pacific
- 5.5.5 Middle East and Africa
- 5.5.5.1 Middle East
- 5.5.5.1.1 United Arab Emirates
- 5.5.5.1.2 Saudi Arabia
- 5.5.5.1.3 Turkey
- 5.5.5.1.4 Rest of Middle East
- 5.5.5.2 Africa
- 5.5.5.2.1 South Africa
- 5.5.5.2.2 Nigeria
- 5.5.5.2.3 Egypt
- 5.5.5.2.4 Rest of Africa
- 5.5.5.1 Middle East
- 5.5.1 North America
6 COMPETITIVE LANDSCAPE
- 6.1 Market Concentration
- 6.2 Strategic Moves
- 6.3 Market Share Analysis
- 6.4 Company Profiles (includes Global level Overview, Market level overview, Core Segments, Financials as available, Strategic Information, Market Rank/Share for key companies, Products and Services, and Recent Developments)
- 6.4.1 Octo Telematics S.p.A.
- 6.4.2 Cambridge Mobile Telematics, Inc.
- 6.4.3 Geotab Inc.
- 6.4.4 CalAmp Corp.
- 6.4.5 Samsara Inc.
- 6.4.6 Trak Global Group Ltd
- 6.4.7 Zubie, Inc.
- 6.4.8 Mojio Inc.
- 6.4.9 Queclink Wireless Solutions Co. Ltd
- 6.4.10 Telit Cinterion PLC
- 6.4.11 Sensata Technologies Holding plc
- 6.4.12 Laird Connectivity LLC
- 6.4.13 Kuantum Pvt Ltd (Kruzr)
- 6.4.14 Smart Things Lab Co. Ltd
- 6.4.15 Roost Inc.
- 6.4.16 Notion (fka Iris Inc.)
- 6.4.17 Eddy Solutions Inc.
- 6.4.18 HSB ("Sensor Solutions by HSB")
- 6.4.19 ThingCo Global Ltd
- 6.4.20 LexisNexis Risk Solutions Group
- 6.4.21 Flow Insurance Ltd
- 6.4.22 Kinsa Inc.
- 6.4.23 Metromile Enterprise Solutions
- 6.4.24 Safehub, Inc.
- 6.4.25 Parsyl, Inc.
7 MARKET OPPORTUNITIES AND FUTURE TRENDS
- 7.1 White-Space and Unmet-Need Assessment

