PUBLISHER: Mordor Intelligence | PRODUCT CODE: 2124077

PUBLISHER: Mordor Intelligence | PRODUCT CODE: 2124077
Smart Pole - Market Share Analysis, Industry Trends & Statistics, Growth Forecasts (2026 - 2031)
According to Mordor Intelligence, the smart pole market size is expected to grow from USD 24.06 billion in 2025 to USD 28.86 billion in 2026 and is forecast to reach USD 71.65 billion by 2031 at 19.95% CAGR over 2026-2031.
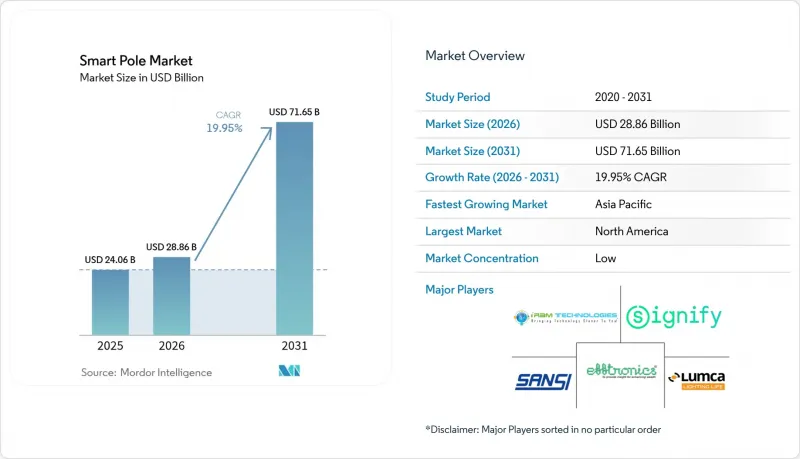
This report is Segmented by Offering (Hardware Units, Software Platforms, and Services), Installation Type (New Installation and Retrofit), Connectivity Technology (Wired, Wireless, and Cellular), Application (Highways and Roadways, and More), Material (Steel/Aluminum, Composite and CFRP, and Concrete), and Geography. The Market Sizes and Forecasts are Provided in Terms of Value (USD) for all the Above Segments.
Global Smart Pole Market Trends and Insights
Government Smart-City Mandates
Nation-level programmes anchor the smart pole market because municipalities must modernise lighting grids to meet climate neutrality, safety, and data-governance targets. The European Commission's Cities Mission calls for 100 climate-neutral cities by 2030 and prescribes integrated digital infrastructure, including multi-service poles. In China, May 2024 guidance from the National Development and Reform Commission obliges city planners to fold smart poles into unified data platforms, accelerating standardised procurement. Chicago's smart-lighting programme reports USD 10 million annual energy savings while enhancing crime monitoring through pole-mounted sensors. Such directives foster predictable procurement cycles that permit volume manufacturing and lower per-unit costs.
LED-Retrofit Energy-Savings Push
LED retrofits deliver 50-60% energy savings compared with high-pressure sodium lamps, giving cities an immediate fiscal incentive to adopt smart poles. Parramatta's USD 5.55 million LED rollout swapped 4,500 luminaires, cutting energy bills and adding adaptive dimming. The U.S. Department of Energy notes that utility financing and energy-service contracts can cover upfront costs, unlocking adoption by budget-strapped towns. Incremental retrofits also avoid wholesale street works, allowing phased integration of sensors and connectivity modules across existing assets. As jurisdictions publicise cost-avoidance metrics, they create peer pressure that keeps the smart pole market on a rapid adoption curve.
High Upfront Capex and ROI Risk
Municipal budgets rarely stretch to multi-million-dollar lighting upgrades without clear payback. In upstate New York, utilities require USD 5 million liability cover for smart streetlight pilots, inflating overall project cost. Wal-Mart's car-park case study shows a 7.5-year payback when replacing 1,000 W metal halide fittings with LEDs, far longer than most city budget cycles. Public-private partnerships such as value-capture funding, showcased by Vijayawada's Golden Mile, redistribute risk to concessionaires, yet smaller cities often lack the legal capacity to structure similar deals, muting near-term demand.
Other drivers and restraints analyzed in the detailed report include:
- 5G Small-Cell Co-Location Demand
- Falling IoT-Sensor Costs
- Interoperability Gaps in Protocols
For complete list of drivers and restraints, kindly check the Table Of Contents.
Segment Analysis
Hardware purchases amounted to 67.20% of the smart pole market in 2025 as poles, luminaires, sensors, and communications gear demand significant upfront capital. Software, though presently a smaller line-item, is compounding at 21.8% annually, signalling a pivot from asset delivery to data services. Signify converts 93% of its EUR 6.1 billion lighting sales into LED units, demonstrating how economies of scale reduce capital costs for municipalities.
Firms now position cloud dashboards, API gateways, and AI-driven analytics as core value streams. Wide-area device management cuts truck rolls, while predictive maintenance extends asset life, improving total-life economics. Consequently, recurring licence and support fees are beginning to rival hardware margins, a progression that underpins long-run growth for the smart pole market.
New installations comprised 56.30% of 2025 revenue because green-field smart-city districts favour custom-engineered poles with embedded radios, CCTV, and EV chargers. Retrofit programmes, however, should log a 20.1% CAGR through 2031, outpacing new builds, as cities swap sodium lamps for LED heads plus plug-in sensor modules. Chicago upgraded 270,000 lights to LED while adding remote-control nodes, cutting energy use, and enabling crime analytics.
Retrofits exploit existing power feeds and foundations, trimming civil works costs by as much as 30%. Payback windows can narrow to 4-5 years, suiting municipal budgeting cycles and supporting distributed rollouts. The pattern broadens geographic access, reinforcing demand diversity within the smart pole market.
Complete Report Scope:
- By Offering
- Hardware Units
- Software Platform
- Services
- By Installation Type
- New Installation
- Retrofit
- By Connectivity Technology
- Wired (PLC, Fiber)
- Wireless (Wi-Fi, BLE, Zigbee)
- Cellular (4G/LTE, 5G, NB-IoT)
- By Application
- Highways and Roadways
- Public Places and Plazas
- Railways and Harbors
- Parking Lots and Campuses
- By Material
- Steel/Aluminum
- Composite and CFRP
- Concrete
- By Region
- North America
- United States
- Canada
- Mexico
- South America
- Argentina
- Brazil
- Rest of South America
- Europe
- United Kingdom
- Germany
- France
- Rest of Europe
- Asia-Pacific
- China
- Japan
- India
- Rest of Asia-Pacific
- Middle East and Africa
- Saudi Arabia
- United Arab Emirates
- South Africa
- Rest of Middle East and Africa
- North America
Geography Analysis
North America commanded 35.10% of 2025 revenue, underpinned by large-scale LED retrofits and utility financing. The New York Power Authority's plan to network 500,000 streetlights with Signify's Interact platform highlights project scale and replicability. Robust municipal bond markets facilitate capital access, while broadband carriers harness smart poles to fill suburban 5G gaps, keeping order pipelines steady.
Asia Pacific is the quickest-growing arena, rising at 23.6% CAGR to 2031. China issued national guidelines urging "vehicle-road-cloud" integration, mandating sensorized roadside units that dovetail with multipurpose poles. India's Smart Cities Mission budgeted INR 11.21 lakh crore (USD 1.35 billion) for 2025-26, of which 90% of 8,000 projects were completed by mid-2024, creating ready-made demand funnels.
Europe maintains consistent expansion owing to the EU's Digital Europe and Horizon 2020 funds. The bloc allocated EUR 1.4 billion to smart-infrastructure pilots in 134 cities, providing de-risked capital pools. Cornerstone's partnership with Signify to mount neutral-host 5G radios on street lighting demonstrates how infrastructure sharing cuts operator opex, keeping deal flow healthy despite macro headwinds.
- Signify Holding NV
- Valmont Industries Inc.
- Iram Technologies Pvt Ltd
- Indus Towers Ltd
- Lumca Inc.
- Efftronics Systems Pvt Ltd
- Shanghai Sansi Electronic Engg.
- SmartCiti Solutions Inc.
- American Tower Corp.
- ENE.HUB Pty Ltd
- Cisco Systems Inc.
- Telensa Ltd
- CU Phosco Lighting
- Keselec Lighting Pvt Ltd
- LEDbow Technologies Ltd
- Norsk Hydro ASA
- Streetscape International
- Omniflow SA
- Ericsson AB
- Nokia Corp.
- HUB Group
Additional Benefits:
- The market estimate (ME) sheet in Excel format
- 3 months of analyst support
TABLE OF CONTENTS
1 INTRODUCTION
- 1.1 Study Assumptions and Market Definition
- 1.2 Scope of the Study
2 RESEARCH METHODOLOGY
3 EXECUTIVE SUMMARY
4 MARKET LANDSCAPE
- 4.1 Market Overview
- 4.2 Market Drivers
- 4.2.1 Government smart-city mandates
- 4.2.2 LED-retrofit energy-savings push
- 4.2.3 5G/small-cell co-location demand
- 4.2.4 Falling IoT-sensor costs
- 4.2.5 Ad-revenue and data-monetisation PPPs
- 4.2.6 ESG-linked muni-bond funding
- 4.3 Market Restraints
- 4.3.1 High upfront capex and ROI risk
- 4.3.2 Interoperability gaps in protocols
- 4.3.3 Urban-aesthetic zoning limits
- 4.3.4 Cyber-physical insurance premiums
- 4.4 Value/Supply-Chain Analysis
- 4.5 Regulatory Landscape
- 4.6 Technological Outlook
- 4.7 Porter's Five Forces Analysis
- 4.7.1 Threat of New Entrants
- 4.7.2 Bargaining Power of Buyers
- 4.7.3 Bargaining Power of Suppliers
- 4.7.4 Threat of Substitutes
- 4.7.5 Competitive Rivalry
- 4.8 COVID-19 and Macroeconomic Impact
- 4.9 Investment Analysis
5 MARKET SIZE AND GROWTH FORECASTS (VALUE)
- 5.1 By Offering
- 5.1.1 Hardware Units
- 5.1.2 Software Platform
- 5.1.3 Services
- 5.2 By Installation Type
- 5.2.1 New Installation
- 5.2.2 Retrofit
- 5.3 By Connectivity Technology
- 5.3.1 Wired (PLC, Fiber)
- 5.3.2 Wireless (Wi-Fi, BLE, Zigbee)
- 5.3.3 Cellular (4G/LTE, 5G, NB-IoT)
- 5.4 By Application
- 5.4.1 Highways and Roadways
- 5.4.2 Public Places and Plazas
- 5.4.3 Railways and Harbors
- 5.4.4 Parking Lots and Campuses
- 5.5 By Material
- 5.5.1 Steel/Aluminum
- 5.5.2 Composite and CFRP
- 5.5.3 Concrete
- 5.6 By Region
- 5.6.1 North America
- 5.6.1.1 United States
- 5.6.1.2 Canada
- 5.6.1.3 Mexico
- 5.6.2 South America
- 5.6.2.1 Argentina
- 5.6.2.2 Brazil
- 5.6.2.3 Rest of South America
- 5.6.3 Europe
- 5.6.3.1 United Kingdom
- 5.6.3.2 Germany
- 5.6.3.3 France
- 5.6.3.4 Rest of Europe
- 5.6.4 Asia-Pacific
- 5.6.4.1 China
- 5.6.4.2 Japan
- 5.6.4.3 India
- 5.6.4.4 Rest of Asia-Pacific
- 5.6.5 Middle East and Africa
- 5.6.5.1 Saudi Arabia
- 5.6.5.2 United Arab Emirates
- 5.6.5.3 South Africa
- 5.6.5.4 Rest of Middle East and Africa
- 5.6.1 North America
6 COMPETITIVE LANDSCAPE
- 6.1 Market Concentration
- 6.2 Strategic Moves
- 6.3 Market Share Analysis
- 6.4 Company Profiles (includes Global level Overview, Market level overview, Core Segments, Financials as available, Strategic Information, Market Rank/Share for key companies, Products and Services, and Recent Developments)
- 6.4.1 Signify Holding NV
- 6.4.2 Valmont Industries Inc.
- 6.4.3 Iram Technologies Pvt Ltd
- 6.4.4 Indus Towers Ltd
- 6.4.5 Lumca Inc.
- 6.4.6 Efftronics Systems Pvt Ltd
- 6.4.7 Shanghai Sansi Electronic Engg.
- 6.4.8 SmartCiti Solutions Inc.
- 6.4.9 American Tower Corp.
- 6.4.10 ENE.HUB Pty Ltd
- 6.4.11 Cisco Systems Inc.
- 6.4.12 Telensa Ltd
- 6.4.13 CU Phosco Lighting
- 6.4.14 Keselec Lighting Pvt Ltd
- 6.4.15 LEDbow Technologies Ltd
- 6.4.16 Norsk Hydro ASA
- 6.4.17 Streetscape International
- 6.4.18 Omniflow SA
- 6.4.19 Ericsson AB
- 6.4.20 Nokia Corp.
- 6.4.21 HUB Group
7 MARKET OPPORTUNITIES AND FUTURE OUTLOOK
- 7.1 White-space and Unmet-Need Assessment

