PUBLISHER: Mordor Intelligence | PRODUCT CODE: 2124089

PUBLISHER: Mordor Intelligence | PRODUCT CODE: 2124089
Encoder - Market Share Analysis, Industry Trends & Statistics, Growth Forecasts (2026 - 2031)
According to Mordor Intelligence, the encoder market size in 2026 is estimated at USD 3.85 billion, growing from 2025 value of USD 3.56 billion with 2031 projections showing USD 5.71 billion, growing at 8.21% CAGR over 2026-2031.
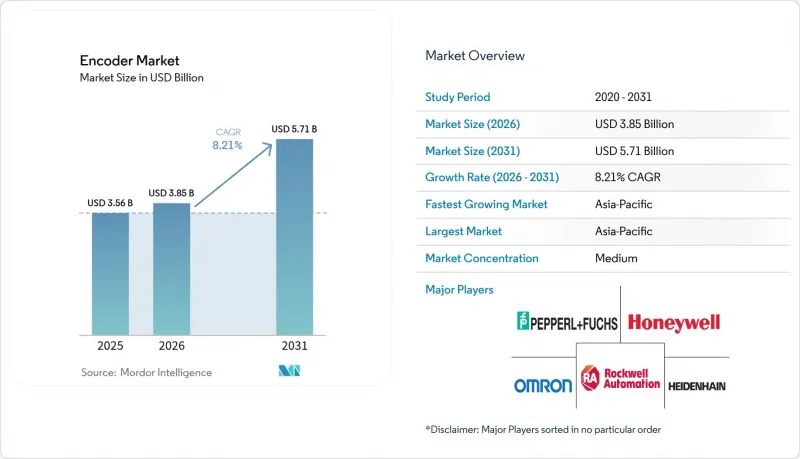
This report is Segmented by Type (Rotary and Linear), Technology (Optical, Magnetic, and More), Output Signal (Incremental, Absolute), End-User Industry (Automotive, Electronics, and More), and Geography. The Market Forecasts are Provided in Terms of Value (USD).
Global Encoder Market Trends and Insights
EU adoption of collaborative robots
Wider use of cobots in German, French, and Nordic plants requires sub-micron feedback to guarantee safe human-robot interaction. OEMs now specify encoders with 1 nm resolution and +-4 µm system accuracy to meet force-limiting norms, enabling robots to detect the slightest contact and halt within milliseconds. High-resolution absolute optics such as Renishaw's RESOLUTE line meet these thresholds and support speeds up to 100 m/s, letting automation suppliers increase throughput without compromising worker protection. Broader deployment of ISO / TS 15066-compliant systems is therefore lifting average selling prices across the encoder market even as unit volumes climb .
China's smart packaging lines
Electronics and pharmaceutical packagers in China run lines that position parts at sub-100 nm tolerances while cycling hundreds of units per minute. Vibration, thermal fluctuation, and airborne particulates force line builders to blend optical scales with rugged housings or shift to inductive formats that still deliver nanometer-grade precision. Each expansion project typically specifies multiple axes of feedback, so growth in this vertical materially raises encoder shipments. Provincial subsidies for fully automated factories amplify demand by lowering capital hurdles for mid-tier manufacturers.
Optical contamination failures in dust-intensive ASEAN steel mills
Particulate fallout in blast-furnace bays obstructs traditional code discs, leading to sudden position loss and unscheduled outages. Facility managers now pivot toward magnetic or inductive sensing that tolerates debris without sacrificing uptime, curbing replacement demand for optical models and marginally slowing encoder market revenue in heavy-industry niches .
Other drivers and restraints analyzed in the detailed report include:
- Functional-safety (SIL 2/3) rules in Japanese process industries
- PLI-backed CNC machine-tool growth in India
- Suzhou & Shenzhen low-cost magnetic IC encoders driving price erosion
For complete list of drivers and restraints, kindly check the Table Of Contents.
Segment Analysis
Rotary devices generated 72.65% of encoder market revenue in 2025 as virtually every servo motor and robot joint needs angular feedback. Their entrenched base, wide shaft-size offerings, and direct compatibility with off-the-shelf drives keep demand buoyant. Linear encoders, however, post a 7.28% CAGR to 2031 as semiconductor steppers, lithography stages, and direct-drive tables prioritise friction-free translation. The encoder market size for linear solutions is set to climb from USD 973.66 million in 2025 to USD 1.48 billion in 2031, propelled by machine-tool builders replacing ball-screw rigs with air-bearing or magnetic levitation slides. Growth in additive manufacturing also favours linear scales that provide closed-loop z-axis control at sub-micron granularity.
Emerging use of enclosed designs such as Renishaw's FORTiS reduces downtime in coolant-rich machining centres, while ultra-high-vacuum variants capture share in EUV lithography chambers. Although retrofits sustain rotary volumes, new-build capital equipment increasingly incorporates dual sensors-rotary for spindle position and linear for carriage motion raising overall encoder market shipments without cannibalising either sub-category.
Optical encoders retained 51.85% revenue in 2025, driven by 1 nm resolution models required in wafer steppers, coordinate-measuring machines, and high-end cobots. The encoder market share for optical units may slip marginally by 2031 as magnetic options cut the historical resolution gap. Magnetic devices expand at an 8.17% CAGR because they withstand oil mist, dust, and wide temperature swings, lowering total cost of ownership in steel, mining, and wind-turbine applications. Battery-free absolute magnetics recently launched by Nidec further widen use cases by eliminating supercapacitors and maintenance cycles .
Capacitive and inductive platforms occupy well-defined niches: capacitive encoders resist electromagnetic interference for MRI beds and semiconductor ion implanters, whereas inductive solutions thrive in food-grade or wash-down zones thanks to fully sealed housings. Suppliers devote R&D dollars to hybrid stacks that blend optical code strips with magnetic reference tracks, handling high axial misalignment without loss of nanometric repeatability. This convergence should keep encoder market differentiation centred on firmware, diagnostics, and connectivity rather than pure sensing physics.
Complete Report Scope:
- By Type
- Rotary
- Linear
- By Technology
- Optical
- Magnetic
- Capacitive
- Inductive
- Other Technologies
- By Output Signal
- Incremental
- Absolute
- By End-user Industry
- Automotive
- Electronics and Semiconductor
- Industrial
- Textile
- Printing Machinery
- Medical Devices
- Energy and Power
- Aerospace and Defense
- Other End-user Industries
- By Geography
- North America
- United States
- Canada
- Mexico
- South America
- Brazil
- Argentina
- Rest of South America
- Europe
- Germany
- United Kingdom
- France
- Italy
- Spain
- Rest of Europe
- Asia-Pacific
- China
- Japan
- South Korea
- India
- Australia
- New Zealand
- Rest of Asia-Pacific
- Middle East and Africa
- United Arab Emirates
- Saudi Arabia
- South Africa
- Rest of Middle East and Africa
- North America
Geography Analysis
Asia-Pacific led with 35.25% of global revenue in 2025 and sustains a 9.45% CAGR through 2031. Chinese policy backing for smart factories and compound-semiconductor fabs continues to funnel encoder orders into coastal provinces. Japan's installed robot base exceeds 420 units per 10,000 workers, keeping demand resilient for SIL-rated feedback components that fit legacy servo footprints. India's PLI tranche drives the fastest incremental gains, with encoder call-offs attaching to new CNC, PCB, and medical-device lines financed under the scheme. The encoder market size in Asia-Pacific therefore moves from USD 1.26 billion in 2025 toward USD 2.16 billion in 2031.
North America and Europe together represent roughly half of 2025 turnover, powered by aerospace, medical robotics, and precision machining. The United States anchors clinical-grade demand: Johnson & Johnson MedTech's OTTAVA(TM) surgical platform integrates ultra-compact optical encoders on every robotic arm to secure sub-millimetre repeatability. German and Swiss suppliers export high-accuracy scales worldwide, cementing Europe's role as an innovation hub even as unit volumes migrate East. EU subsidies for collaborative-robot deployment channel revenue toward 1 nm-class feedback solutions, lifting average selling price across the region.
Latin America and the Middle East & Africa remain smaller contributor regions yet post steady single-digit growth as brownfield plants retrofit automated conveyors, palletisers, and bottling lines. Brazilian auto assemblers and Mexican Tier-1 suppliers now add magnetic encoders to motor drives as part of broader Industry 4.0 overhauls. Gulf-state oil producers specify ruggedised inductive and magnetic designs rated to 125 °C ambient and certified for Class 1 Div 2 zones. This uptake diversifies the global encoder market and cushions suppliers against cyclical slowdowns in any one geography.
- Omron Corporation
- Dr. Johannes Heidenhain GmbH
- Honeywell International
- Rockwell Automation Inc.
- Pepperl+Fuchs SE
- Panasonic Holdings Corp.
- Baumer Holding AG
- Sensata Technologies (Hengstler and Dynapar)
- Renishaw plc
- SICK AG
- Maxon Group
- FAULHABER Drive Systems
- Allied Motion Technologies
- AMETEK (Haydon Kerk, Maurey)
- Canon Precision Inc.
- CUI Devices
- TE Connectivity
- Posital FRABA B.V.
- Tamagawa Seiki Co., Ltd.
Additional Benefits:
- The market estimate (ME) sheet in Excel format
- 3 months of analyst support
TABLE OF CONTENTS
1 INTRODUCTION
- 1.1 Study Assumptions and Market Definition
- 1.2 Scope of the Study
2 RESEARCH METHODOLOGY
3 EXECUTIVE SUMMARY
4 MARKET LANDSCAPE
- 4.1 Market Overview
- 4.2 Market Drivers
- 4.2.1 EU Adoption of Collaborative Robots Driving High-Precision Encoders
- 4.2.2 Chinas Smart Packaging Lines Requiring Sub-Micron Resolution Encoders
- 4.2.3 Functional-Safety (SIL 2/3) Regulations in Japanese Process Industries
- 4.2.4 PLI-Backed CNC Machine-Tool Growth in India Elevating Rotary Encoder Demand
- 4.2.5 OEM Migration to Integrated Motor-Encoder Modules in US Medical Robotics
- 4.3 Market Restraints
- 4.3.1 Optical Contamination Failures in Dust-Intensive ASEAN Steel Mills
- 4.3.2 Suzhou and Shenzhen Low-Cost Magnetic IC Encoders Driving Price Erosion
- 4.3.3 US-EU Export Controls Limiting Ultra-Precision Encoders for China Lithography
- 4.4 Regulatory Outlook
- 4.5 Porter's Five Forces Analysis
- 4.5.1 Bargaining Power of Suppliers
- 4.5.2 Bargaining Power of Buyers
- 4.5.3 Threat of New Entrants
- 4.5.4 Threat of Substitutes
- 4.5.5 Intensity of Competitive Rivalry
5 MARKET SIZE AND GROWTH FORECASTS (VALUE)
- 5.1 By Type
- 5.1.1 Rotary
- 5.1.2 Linear
- 5.2 By Technology
- 5.2.1 Optical
- 5.2.2 Magnetic
- 5.2.3 Capacitive
- 5.2.4 Inductive
- 5.2.5 Other Technologies
- 5.3 By Output Signal
- 5.3.1 Incremental
- 5.3.2 Absolute
- 5.4 By End-user Industry
- 5.4.1 Automotive
- 5.4.2 Electronics and Semiconductor
- 5.4.3 Industrial
- 5.4.4 Textile
- 5.4.5 Printing Machinery
- 5.4.6 Medical Devices
- 5.4.7 Energy and Power
- 5.4.8 Aerospace and Defense
- 5.4.9 Other End-user Industries
- 5.5 By Geography
- 5.5.1 North America
- 5.5.1.1 United States
- 5.5.1.2 Canada
- 5.5.1.3 Mexico
- 5.5.2 South America
- 5.5.2.1 Brazil
- 5.5.2.2 Argentina
- 5.5.2.3 Rest of South America
- 5.5.3 Europe
- 5.5.3.1 Germany
- 5.5.3.2 United Kingdom
- 5.5.3.3 France
- 5.5.3.4 Italy
- 5.5.3.5 Spain
- 5.5.3.6 Rest of Europe
- 5.5.4 Asia-Pacific
- 5.5.4.1 China
- 5.5.4.2 Japan
- 5.5.4.3 South Korea
- 5.5.4.4 India
- 5.5.4.5 Australia
- 5.5.4.6 New Zealand
- 5.5.4.7 Rest of Asia-Pacific
- 5.5.5 Middle East and Africa
- 5.5.5.1 United Arab Emirates
- 5.5.5.2 Saudi Arabia
- 5.5.5.3 South Africa
- 5.5.5.4 Rest of Middle East and Africa
- 5.5.1 North America
6 COMPETITIVE LANDSCAPE
- 6.1 Strategic Moves
- 6.2 Vendor Positioning Analysis
- 6.3 Company Profiles {includes Global-level Overview, Market-level Overview, Core Segments, Financials as available, Strategic Information, Products and Services, Recent Developments}
- 6.3.1 Omron Corporation
- 6.3.2 Dr. Johannes Heidenhain GmbH
- 6.3.3 Honeywell International
- 6.3.4 Rockwell Automation Inc.
- 6.3.5 Pepperl+Fuchs SE
- 6.3.6 Panasonic Holdings Corp.
- 6.3.7 Baumer Holding AG
- 6.3.8 Sensata Technologies (Hengstler and Dynapar)
- 6.3.9 Renishaw plc
- 6.3.10 SICK AG
- 6.3.11 Maxon Group
- 6.3.12 FAULHABER Drive Systems
- 6.3.13 Allied Motion Technologies
- 6.3.14 AMETEK (Haydon Kerk, Maurey)
- 6.3.15 Canon Precision Inc.
- 6.3.16 CUI Devices
- 6.3.17 TE Connectivity
- 6.3.18 Posital FRABA B.V.
- 6.3.19 Tamagawa Seiki Co., Ltd.
7 MARKET OPPORTUNITIES AND FUTURE OUTLOOK
- 7.1 White-space and Unmet-Need Assessment

