PUBLISHER: Mordor Intelligence | PRODUCT CODE: 2124101

PUBLISHER: Mordor Intelligence | PRODUCT CODE: 2124101
Electrically Conductive Coating - Market Share Analysis, Industry Trends & Statistics, Growth Forecasts (2026 - 2031)
According to Mordor Intelligence, the electrically conductive coating market size is projected to grow from USD 24.67 billion in 2025 to USD 26.01 billion in 2026, and reach USD 34.49 billion by 2031, growing at a CAGR of 5.81% from 2026 to 2031.
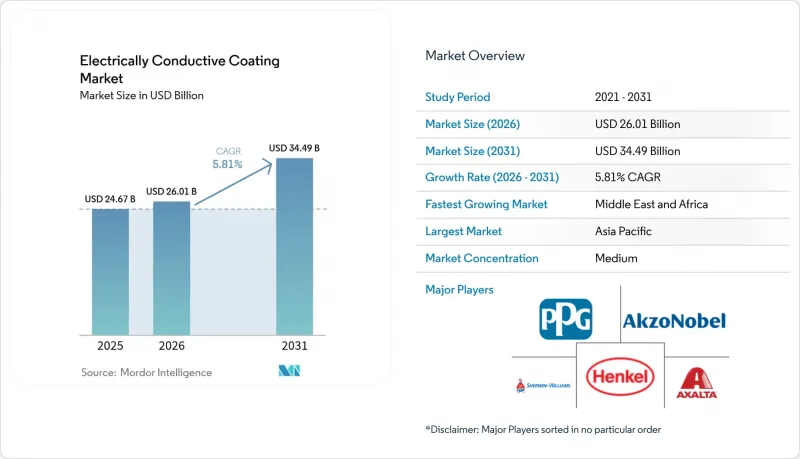
This report is Segmented by Type (Acrylics, Epoxy, Polyesters, and More), Conductive Filler Material (Copper, Aluminum, and More), Application (Electronics and Electrical, Automotive, Aerospace and Defense, Other Applications), and Geography (Asia-Pacific, North America, Europe, South America, and Middle East and Africa). Market Forecasts are Provided in Terms of Value (USD).
Global Electrically Conductive Coating Market Trends and Insights
Rising Applications for Anti-Static Protection
Semiconductor fabs are tightening electrostatic-discharge thresholds below 10 V as gate oxides narrow toward 3 nm, pushing conductive floor and workbench coatings into all new cleanroom builds. Cleanroom additions in Taiwan and South Korea climbed 22% in 2025, with each square meter finished in fast-curing acrylic layers that dissipate charge within 0.1 seconds. Extreme-ultraviolet lithography magnifies risk because a single ESD event can destroy a USD 150,000 reticle; consequently, fabs now specify surface resistivity between 105 and 109 Ω/square. Smaller contract manufacturers in Malaysia and Vietnam are adopting water-based chemistries to meet ISO 14644 particulate limits without volatile-organic-compound penalties, a trajectory that supports mid-single-digit volume growth through 2028. Collectively, these forces are anchoring anti-static coatings as a baseline requirement rather than an optional upgrade.
Growing Demand from Electrical and Electronics Industry
Printed-circuit boards (PCBs) surpassed 820 million m2 of global output in 2025, with conductive coatings applied to roughly 35% of that area to ground high-speed traces. Flagship smartphones now integrate more than 18 layers, and each layer needs selective coatings for via fill and EMI suppression. As 5G handsets doubled antenna counts, conformal coatings that maintain conductivity across curved solder joints became mandatory, lifting demand in China, South Korea, and Japan. Display makers are embedding touch sensors into OLED stacks, displacing brittle indium tin oxide with silver-nanowire dispersions that better tolerate flexing. This architecture shift should add an incremental 120 million m2 of coating demand annually by 2029.
Toxicity and Environmental Concerns of Heavy-Metal Fillers
RoHS caps cadmium at 100 ppm and lead at 1,000 ppm in electronics, forcing reformulation of legacy coatings that once relied on cadmium oxide for corrosion resistance. Compliance testing adds about USD 50,000 per SKU and can double the qualification timetable for aerospace or automotive programs. REACH dossiers for nano-silver now require aquatic-toxicity data, as LC50 values below 10 µg/L for Daphnia magna triggered hazard classification and stricter transport rules. China's draft heavy-metal limits signal that similar rules will land in APAC by 2027. Although graphene and carbon nanotubes can substitute, their production costs run 30-40% above silver flakes, slowing broad adoption.
Other drivers and restraints analyzed in the detailed report include:
- Surge in Adoption of EMI/RFI Shielding in 5G Infrastructure
- Rapid Miniaturization in Wearable Electronics
- Volatility in Silver and Copper Prices
For complete list of drivers and restraints, kindly check the Table Of Contents.
Segment Analysis
Acrylics retained 34.28% share of the electrically conductive coating market in 2025, owing to fast UV curing and compatibility with roll-to-roll PCB lines. Polyurethanes, however, are projected to grow at a 6.22% CAGR, outpacing the overall electronically conductive coating market size growth because EV battery packs, automotive interiors, and health-wearables need coatings that endure 100,000 flex cycles without cracking. Epoxies remain the choice for high-heat avionics that see >=150 °C, while polyesters fill outdoor telecom niches where weatherability matters more than ultimate conductivity.
Polyurethane adoption is accelerating in battery-management systems that swing from -40 °C to 85 °C, conditions that delaminate acrylics within 500 cycles. Automakers now specify room-temperature-curing two-component urethanes, trimming oven energy costs and cutting takt time. Acrylic vendors are responding with hybrid chemistries that graft polyurethane oligomers onto acrylic backbones, but these blends sacrifice the 30-second tack-free cure that once gave acrylics a throughput edge.
Complete Report Scope:
- By Type
- Acrylics
- Epoxy
- Polyesters
- Polyurethanes
- Other Types
- By Conductive Filler Material
- Copper
- Aluminum
- Silver
- Other Material Types
- By Application
- Electronics and Electrical
- Automotive
- Aerospace and Defense
- Other Applications
- By Geography
- Asia-Pacific
- China
- India
- Japan
- South Korea
- Malaysia
- Thailand
- Indonesia
- Vietnam
- Rest of Asia-Pacific
- North America
- United States
- Canada
- Mexico
- Europe
- Germany
- United Kingdom
- France
- Italy
- Spain
- Russia
- NORDIC Countries
- Rest of Europe
- South America
- Brazil
- Argentina
- Rest of South America
- Middle-East and Africa
- Saudi Arabia
- United Arab Emirates
- Egypt
- South Africa
- Rest of Middle-East and Africa
- Asia-Pacific
Geography Analysis
Asia-Pacific controlled 48.37% of global revenue in 2025, underpinned by vertically integrated clusters in Shenzhen, Suzhou, and Penang, where coating formulators, PCB shops, and final assemblers operate within the same-day trucking lanes. China alone consumed 180,000 tons of conductive coatings in 2025 on the back of 9 million EVs produced and aggressive 5G roll-outs. India's Production-Linked Incentive scheme lifted domestic electronics output 28%, expanding coating imports as local capacity rose from 12,000 tons to 18,000 tons. Japan and South Korea dominate high-value niches such as biocompatible and high-temperature epoxies, commanding 20-30% price premiums. Southeast Asian nations are winning assembly work relocating from China, but resin and filler ecosystems lag, keeping them import-dependent.
North American electrically conductive coatings demand is concentrated in automotive, aerospace, and data-center hardware. The U.S. Inflation Reduction Act incentivizes coatings made near battery plants; three facilities totaling 25,000 tons/year will open by 2027 in Michigan and Georgia. Canada anchors specialty epoxy demand for avionics built in Quebec, while Mexico's nearshoring boom lifted electronics production 16% as wire-harness and medical-device assemblers expanded, albeit still reliant on imported coatings.
Europe captured significant market share in 2025, with Germany, France, and the U.K. driving automotive and industrial demand. Stringent RoHS and REACH rules are accelerating the pivot to copper and graphene while hiking compliance costs that push smaller suppliers to exit. The EU Battery Regulation mandates EMI shielding on traction batteries exceeding 2 kWh, locking in a recurring volume stream from electric-vehicle lines. South America and the Middle East and Africa share 9% of revenue; the latter is the fastest-growing region at 5.98% CAGR, powered by Saudi and UAE data-center builds that demand 60 dB shielding for high-density racks. Brazil's flex-fuel vehicles absorbed around 4,500 tons of coatings in 2025, but Argentina's market dragged due to tariffs and currency volatility.
- A & A Coatings
- Akzo Nobel NV
- Ameetuff Technical Paints Industries
- Axalta Coating Systems
- BeDimensional
- CAIG
- Creative Materials Inc.
- Cromas Paints
- Gelest Inc.
- Henkel AG & Co. KGaA
- Holland Shielding Systems BV
- MG Chemicals
- Parker-Hannifin Corporation
- PPG Industries Inc.
- RS Coatings
- Specialty Coating Systems Inc.
- The Sherwin-Williams Company
Additional Benefits:
- The market estimate (ME) sheet in Excel format
- 3 months of analyst support
TABLE OF CONTENTS
1 Introduction
- 1.1 Study Assumptions and Market Definition
- 1.2 Scope of the Study
2 Research Methodology
3 Executive Summary
4 Market Landscape
- 4.1 Market Overview
- 4.2 Market Drivers
- 4.2.1 Rising applications for anti-static protection
- 4.2.2 Growing demand from electrical and electronics industry
- 4.2.3 Surge in adoption of EMI/RFI shielding in 5G infrastructure
- 4.2.4 Rapid miniaturization in wearable electronics
- 4.2.5 Conductive bio-compatible coatings for implants
- 4.3 Market Restraints
- 4.3.1 Toxicity and environmental concerns of heavy-metal fillers
- 4.3.2 Volatility in silver and copper prices
- 4.3.3 Dispersion issues of nano-fillers causing defects
- 4.4 Value Chain Analysis
- 4.5 Porter's Five Forces
- 4.5.1 Threat of New Entrants
- 4.5.2 Bargaining Power of Buyers
- 4.5.3 Bargaining Power of Suppliers
- 4.5.4 Threat of Substitute Products
- 4.5.5 Degree of Competition
5 Market Size and Growth Forecasts (Value)
- 5.1 By Type
- 5.1.1 Acrylics
- 5.1.2 Epoxy
- 5.1.3 Polyesters
- 5.1.4 Polyurethanes
- 5.1.5 Other Types
- 5.2 By Conductive Filler Material
- 5.2.1 Copper
- 5.2.2 Aluminum
- 5.2.3 Silver
- 5.2.4 Other Material Types
- 5.3 By Application
- 5.3.1 Electronics and Electrical
- 5.3.2 Automotive
- 5.3.3 Aerospace and Defense
- 5.3.4 Other Applications
- 5.4 By Geography
- 5.4.1 Asia-Pacific
- 5.4.1.1 China
- 5.4.1.2 India
- 5.4.1.3 Japan
- 5.4.1.4 South Korea
- 5.4.1.5 Malaysia
- 5.4.1.6 Thailand
- 5.4.1.7 Indonesia
- 5.4.1.8 Vietnam
- 5.4.1.9 Rest of Asia-Pacific
- 5.4.2 North America
- 5.4.2.1 United States
- 5.4.2.2 Canada
- 5.4.2.3 Mexico
- 5.4.3 Europe
- 5.4.3.1 Germany
- 5.4.3.2 United Kingdom
- 5.4.3.3 France
- 5.4.3.4 Italy
- 5.4.3.5 Spain
- 5.4.3.6 Russia
- 5.4.3.7 NORDIC Countries
- 5.4.3.8 Rest of Europe
- 5.4.4 South America
- 5.4.4.1 Brazil
- 5.4.4.2 Argentina
- 5.4.4.3 Rest of South America
- 5.4.5 Middle-East and Africa
- 5.4.5.1 Saudi Arabia
- 5.4.5.2 United Arab Emirates
- 5.4.5.3 Egypt
- 5.4.5.4 South Africa
- 5.4.5.5 Rest of Middle-East and Africa
- 5.4.1 Asia-Pacific
6 Competitive Landscape
- 6.1 Market Concentration
- 6.2 Strategic Moves
- 6.3 Market Share(%)/Ranking Analysis
- 6.4 Company Profiles (includes Global level Overview, Market level overview, Core Segments, Financials as available, Strategic Information, Products and Services, and Recent Developments)
- 6.4.1 A & A Coatings
- 6.4.2 Akzo Nobel NV
- 6.4.3 Ameetuff Technical Paints Industries
- 6.4.4 Axalta Coating Systems
- 6.4.5 BeDimensional
- 6.4.6 CAIG
- 6.4.7 Creative Materials Inc.
- 6.4.8 Cromas Paints
- 6.4.9 Gelest Inc.
- 6.4.10 Henkel AG & Co. KGaA
- 6.4.11 Holland Shielding Systems BV
- 6.4.12 MG Chemicals
- 6.4.13 Parker-Hannifin Corporation
- 6.4.14 PPG Industries Inc.
- 6.4.15 RS Coatings
- 6.4.16 Specialty Coating Systems Inc.
- 6.4.17 The Sherwin-Williams Company
7 Market Opportunities and Future Outlook
- 7.1 White-space and Unmet-Need Assessment

