PUBLISHER: Mordor Intelligence | PRODUCT CODE: 2124110

PUBLISHER: Mordor Intelligence | PRODUCT CODE: 2124110
Kaolin - Market Share Analysis, Industry Trends & Statistics, Growth Forecasts (2026 - 2031)
According to Mordor Intelligence, the kaolin market size is expected to grow from 47.59 Million tons in 2025 to 49.46 Million tons in 2026 and is forecast to reach 60.87 Million tons by 2031 at 4.24% CAGR over 2026-2031.
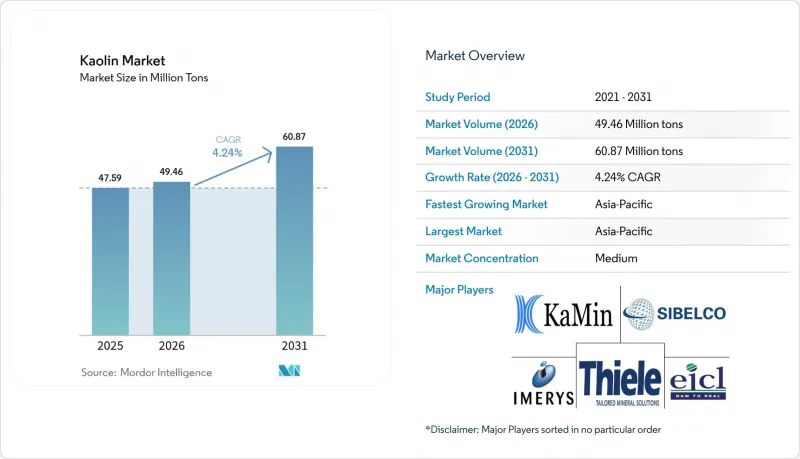
This report is Segmented by Form (Processed Kaolin and Crude/Unprocessed Kaolin), Grade (Hydrous Kaolin, Calcined Kaolin, Delaminated Kaolin, and Other Grades), Application (Ceramics, Cement, Paper, Refractories, Paints and Coatings, Plastics, and More) and Geography (Asia-Pacific, North America, Europe, South America, and Middle-East and Africa). The Market Forecasts are Provided in Terms of Volume (Tons).
Global Kaolin Market Trends and Insights
Booming Sanitary-Ware and Tile Manufacturing
China's tile output exceeds 5 billion m2 annually, consuming 12-15 million tons of kaolin, while India's march toward 3 billion m2 by 2026 could lift domestic demand by another 1.5-2 million tons. The mismatch between India's 8.3 million tons of crude extraction and just 73,000 tons of processing capacity forces tile makers to import high-brightness grades from Malaysia and Indonesia, inflating landed costs by 12-18%. Indonesia and Vietnam are scaling sanitary-ware output to serve mega-projects in the Middle-East, including Saudi Vision 2030 requirements for 8-10 million fixtures. Premium vitreous-china lines require kaolin with less than 1.5% Fe2O3, tightening regional supply and driving spot prices for 90%+ brightness grades 22-25% higher since early 2024. Russia's own shift toward import substitution added another 1 million tons of kaolin demand between 2019 and 2022.
Shift to High-Brightness Packaging Paper
Phasing out PFAS in food-contact paper propels mills to thicken mineral coatings for barrier performance. Kaolin's plate-like structure enhances printability, but digital inkjet now represents 35-40% of packaging print volume and prefers calcium carbonate's greater opacity, trimming kaolin's share to 50-55% in 2025. Delaminated kaolin, just 8-10% of total volume, earns 15-20% premiums for luxury paper stocks, specifically in cosmetics and spirits packaging. Hybrid kaolin-carbonate blends reduced pure-kaolin coat weights by roughly one-third in U.S. and EU mills; however, new Asian machines still specify kaolin-heavy formulations due to sparse carbonate supply chains.
High Energy Intensity and Cost Inflation in Calcination
Flash calcination needs 1.2-1.5 MMBtu per ton, leaving producers exposed to natural-gas volatility. Europe's TTF prices hovered at EUR 35-45 / MWh in 2025, up from EUR 15-20 pre-2022, forcing Sibelco and Imerys to idle 15-20% capacity or raise prices 15-20%. Carbon costs under the EU-ETS add EUR 10-15 per ton of calcined kaolin. U.S. PPI data show kaolin prices rising 18.6% between December 2022 and September 2025 as utilities passed through surcharges. Customers resist further hikes, accelerating partial substitution by calcium carbonate.
Other drivers and restraints analyzed in the detailed report include:
- Growing Demand from Paper and Rubber Industries
- Rapid Adoption of Calcined Kaolin in Li-ion Battery Separator Coatings
- Stringent Mine-Site Environmental Permitting
For complete list of drivers and restraints, kindly check the Table Of Contents.
Segment Analysis
Processed kaolin led the kaolin market size with 70.12% share in 2025, whereas crude/unprocessed kaolin is expanding at a faster 4.89% CAGR to 2031. India's huge 8.3 million tons of crude output contrasts with scarce domestic processing, compelling tile makers to pay import premiums and highlighting a structural arbitrage within the kaolin market. Beneficiation investments by EICL and 20 Microns will add 200,000-300,000 tons of processed capacity by 2027.
Processed kaolin captures premium end uses-battery separators, high-brightness packaging, cosmetics-because multi-stage magnetic separation, bleaching, and spray drying deliver more than 85% brightness and less than 1% Fe2O3. Crude kaolin serves low-end bricks, cement, and agriculture, but is becoming attractive for backward integration in emerging markets craving feedstock security. China's imports of Ukrainian and Russian crude plunged 40-50% after 2022 sanctions, redirecting flows from Australia and Indonesia and tightening the regional kaolin market.
Complete Report Scope:
- By Form
- Processed Kaolin
- Crude/Unprocessed Kaolin
- By Grade
- Hydrous Kaolin
- Calcined Kaolin
- Delaminated Kaolin
- Other Grades
- By Application
- Ceramics
- Cement
- Paper
- Refractories
- Paints and Coatings
- Plastics
- Other Applications
- By Geography
- Asia-Pacific
- China
- India
- Japan
- South Korea
- Rest of Asia-Pacific
- North America
- United States
- Canada
- Mexico
- Europe
- Germany
- United Kingdom
- France
- Italy
- Rest of Europe
- South America
- Brazil
- Argentina
- Rest of South America
- Middle-East and Africa
- Saudi Arabia
- South Africa
- Rest of Middle-East and Africa
- Asia-Pacific
Geography Analysis
Asia-Pacific commanded 43.26% of the kaolin market in 2025 and is projected to expand at 4.94% CAGR through 2031. China transitions toward higher-purity sanitary-ware and advanced ceramics, pushing brightness premiums up 22-25% since early 2024. India is closing its beneficiation gap via 300,000 tons of new capacity by 2027, aiming to cut import premiums of 12-18%. Japan and South Korea import high-purity grades for electronic substrates, pulling supply from the U.S. and Australia.
In North America, the Georgia kaolin belt anchors domestic supply, exporting 1.6-1.8 million tons to China, Mexico, and Japan. KaMin LLC's formation after a EUR 1.43 billion carve-out underscores private-equity bets on mature but cash-rich assets. EV battery investments in Michigan and Tennessee are set to lift calcined-kaolin demand regionally. EPA effluent and dust rules add USD 5-10 million capex per mine but create a moat against new entrants.
Europe faces competitiveness challenges as natural-gas costs and carbon prices inflate calcination economics. Sibelco's 2023 acquisition of Quarzwerke's kaolin business and waste-heat retrofits illustrate a shift toward scale and energy efficiency. South America's vast Amazon reserves stay mostly untapped due to stringent permitting, while Middle-East and Africa rely on imports as Saudi Vision 2030 boosts sanitary-ware requirements.
- 20 Microns
- Active Minerals International LLC
- Ashapura Group
- Burgess Pigment Company
- EICL
- Gebruder Dorfner GmbH & Co.
- Green 360 Technologies
- Imerys
- I-Minerals Inc.
- KaMin LLC / CADAM
- Kaolin AD
- Keramost a.s.
- LASSELSBERGER Group GmbH
- LB MINERALS, Ltd.
- Quarzwerke GmbH
- Sibelco
- Thiele Kaolin Company
- Tokai Clay Industry Co., Ltd.
- Zeotech
Additional Benefits:
- The market estimate (ME) sheet in Excel format
- 3 months of analyst support
TABLE OF CONTENTS
1 Introduction
- 1.1 Study Assumptions and Market Definition
- 1.2 Scope of the Study
2 Research Methodology
3 Executive Summary
4 Market Landscape
- 4.1 Market Overview
- 4.2 Market Drivers
- 4.2.1 Booming sanitary-ware and tile manufacturing
- 4.2.2 Shift to high-brightness packaging paper
- 4.2.3 Growing demand from paper and rubber industries
- 4.2.4 Cosmetics and personal-care industry growth
- 4.2.5 Rapid adoption of calcined kaolin in Li-ion battery separator coatings
- 4.3 Market Restraints
- 4.3.1 High energy intensity and cost inflation in calcination
- 4.3.2 Stringent mine-site environmental permitting
- 4.3.3 Substitution risk from high-opacity calcium carbonates in digital-print papers
- 4.4 Value Chain Analysis
- 4.5 Porter's Five Forces
- 4.5.1 Bargaining Power of Buyers
- 4.5.2 Bargaining Power of Suppliers
- 4.5.3 Threat of New Entrants
- 4.5.4 Threat of Substitutes
- 4.5.5 Degree of Competition
5 Market Size and Growth Forecasts (Volume)
- 5.1 By Form
- 5.1.1 Processed Kaolin
- 5.1.2 Crude/Unprocessed Kaolin
- 5.2 By Grade
- 5.2.1 Hydrous Kaolin
- 5.2.2 Calcined Kaolin
- 5.2.3 Delaminated Kaolin
- 5.2.4 Other Grades
- 5.3 By Application
- 5.3.1 Ceramics
- 5.3.2 Cement
- 5.3.3 Paper
- 5.3.4 Refractories
- 5.3.5 Paints and Coatings
- 5.3.6 Plastics
- 5.3.7 Other Applications
- 5.4 By Geography
- 5.4.1 Asia-Pacific
- 5.4.1.1 China
- 5.4.1.2 India
- 5.4.1.3 Japan
- 5.4.1.4 South Korea
- 5.4.1.5 Rest of Asia-Pacific
- 5.4.2 North America
- 5.4.2.1 United States
- 5.4.2.2 Canada
- 5.4.2.3 Mexico
- 5.4.3 Europe
- 5.4.3.1 Germany
- 5.4.3.2 United Kingdom
- 5.4.3.3 France
- 5.4.3.4 Italy
- 5.4.3.5 Rest of Europe
- 5.4.4 South America
- 5.4.4.1 Brazil
- 5.4.4.2 Argentina
- 5.4.4.3 Rest of South America
- 5.4.5 Middle-East and Africa
- 5.4.5.1 Saudi Arabia
- 5.4.5.2 South Africa
- 5.4.5.3 Rest of Middle-East and Africa
- 5.4.1 Asia-Pacific
6 Competitive Landscape
- 6.1 Market Concentration
- 6.2 Strategic Moves
- 6.3 Market Share(%)/Ranking Analysis
- 6.4 Company Profiles (includes Global level Overview, Market level overview, Core Segments, Financials as available, Strategic Information, Products and Services, and Recent Developments)
- 6.4.1 20 Microns
- 6.4.2 Active Minerals International LLC
- 6.4.3 Ashapura Group
- 6.4.4 Burgess Pigment Company
- 6.4.5 EICL
- 6.4.6 Gebruder Dorfner GmbH & Co.
- 6.4.7 Green 360 Technologies
- 6.4.8 Imerys
- 6.4.9 I-Minerals Inc.
- 6.4.10 KaMin LLC / CADAM
- 6.4.11 Kaolin AD
- 6.4.12 Keramost a.s.
- 6.4.13 LASSELSBERGER Group GmbH
- 6.4.14 LB MINERALS, Ltd.
- 6.4.15 Quarzwerke GmbH
- 6.4.16 Sibelco
- 6.4.17 Thiele Kaolin Company
- 6.4.18 Tokai Clay Industry Co., Ltd.
- 6.4.19 Zeotech
7 Market Opportunities and Future Outlook
- 7.1 White-Space and Unmet-Need Assessment
- 7.2 Growing Demand for Sanitary Ceramics

