PUBLISHER: Mordor Intelligence | PRODUCT CODE: 2124124

PUBLISHER: Mordor Intelligence | PRODUCT CODE: 2124124
Phosphoric Acid - Market Share Analysis, Industry Trends & Statistics, Growth Forecasts (2026 - 2031)
According to Mordor Intelligence, the phosphoric acid market size is projected to be 96.91 million tons in 2025, 100.76 million tons in 2026, and reach 124.07 million tons by 2031, growing at a CAGR of 4.25% from 2026 to 2031.
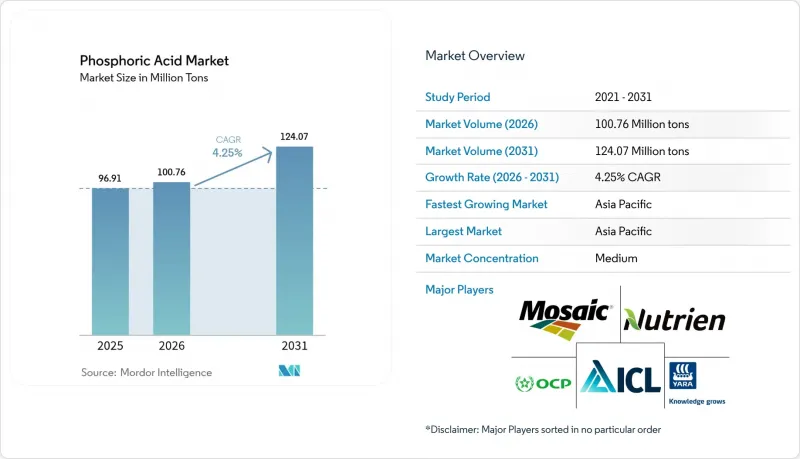
This report is Segmented by Grade (Fertilizer Grade, Food Grade, and More), Process (Wet-Process, Thermal-Process, and Secondary-Source/Recovery), End-User Industry (Fertilizer, Food and Beverages, Chemicals, Medicine, Metallurgy, and More), and Geography (Asia-Pacific, North America, Europe, South America, and the Middle East and Africa). The Market Forecasts are Provided in Terms of Volume (Tons).
Global Phosphoric Acid Market Trends and Insights
Fertilizer-Grade Demand Acceleration in Food-Security Programs
India committed USD 4.2 billion in 2025 to subsidize diammonium phosphate, an outlay that lifted domestic phosphoric acid offtake by 1.8 million tons. The African Union's Agenda 2063 targets fertilizer use of 50 kg per hectare by 2030, triple today's level, pulling in more imported acid across the continent. China's 22% export-quota cut on phosphate rock in 2024 has already rerouted buyers toward Moroccan cargoes, supporting merchant acid pricing above USD 900 per ton through 2027. Sovereign programs are also accelerating backward integration; IFFCO's 500,000-ton Paradip unit entered service in 2025, trimming India's import reliance below 50%.
Processed Food & RTD Beverage Acidulant Uptake
US soft-drink formulators replaced 340,000 tons of citric acid with phosphoric alternatives in 2025 to neutralize tart flavors while meeting the FDA's 0.5% additive ceiling that sits well above normal inclusion rates. Globally, ready-to-drink coffee and tea volumes are rising at a 6.1% CAGR to 2030, each liter requiring phosphoric chelation to prevent protein precipitation. Per-capita soft-drink intake in China is still one-third of the US figure, signaling ample growth headroom. Europe's E338 classification continues to approve phosphoric use in dairy desserts and processed cheese, adding 180,000 tons of demand in 2025.
Rock-Phosphate Supply Shocks from Morocco and China
Morocco's OCP Group controls approximately 70% of global seawater-grade phosphate rock reserves, yet extraction rates at the Khouribga and Youssoufia mines face geological constraints as ore grades decline from 32% P2O5 in 2020 to 28% P2O5 in 2025, requiring higher beneficiation costs. China's 22% export-quota reduction in 2024 limited shipments to 4.8 million tons, forcing Asian buyers to pay USD 85-110 per-ton freight premiums on Moroccan supply. Conveyor sabotage in Western Sahara idled 1.2 million tons of capacity for three months in 2024, exposing a single-source risk.
Other drivers and restraints analyzed in the detailed report include:
- LiFePO4 Battery Production & Closed-Loop Recycling
- High-Purity Electronics-Etch Demand in Semiconductor Fabs
- Zero-Liquid-Discharge Rules Inflating Effluent Costs
For complete list of drivers and restraints, kindly check the Table Of Contents.
Segment Analysis
Fertilizer-grade captured 79.87% of 2025 output, yet food-grade will advance at 4.59% CAGR through 2031 as beverage formulators escalate pH-stabilizer use. Electronics and ultra-pure grade, with their price realization, 8-12 times fertilizer levels, protect margins, a clear benefit for niche suppliers.
Price bifurcation is widening. Taiwan Semiconductor Manufacturing Company's Arizona fab alone locks in 6,800 tons a year of over and equal to 99.999% material with premiums of 40-60% above spot. EFSA's 2024 re-evaluation of additive E338 reinforced the regulatory comfort, stimulating dedicated food-grade investments.
Complete Report Scope:
- By Grade
- Fertilizer Grade
- Food Grade
- Feed Grade
- Industrial Grade
- Electronics/Ultra-pure Grade
- By Process
- Wet-Process
- Thermal-Process
- Secondary-Source/Recovery
- By End-User Industry
- Fertilizer
- Food and Beverages
- Chemicals
- Medicine
- Metallurgy
- Other End-user Industries
- By Geography
- Asia-Pacific
- China
- India
- Japan
- South Korea
- ASEAN
- Rest of Asia-Pacific
- North America
- United States
- Canada
- Mexico
- Europe
- Germany
- United Kingdom
- France
- Italy
- Russia
- Rest of Europe
- South America
- Brazil
- Argentina
- Rest of South America
- Middle-East and Africa
- Saudi Arabia
- United Arab Emirates
- South Africa
- Egypt
- Rest of Middle-East and Africa
- Asia-Pacific
Geography Analysis
Asia-Pacific held 55.97% volume share in 2025 and will lead global expansion at 4.54% CAGR through 2031, propelled by China's 40 million ton annual production capacity and India's drive to halve diammonium phosphate imports by 2028 through backward integration. Japan and South Korea collectively consumed substantial amounts of electronics-grade phosphoric acid in 2025, with Samsung Electronics and SK Hynix securing long-term supply contracts from Prayon and Innophos to support memory-chip production expansions.
In North America, Mosaic's Florida-Louisiana chain produced 4.8 million tons, but Asia-Pacific will continue to outrun Western tonnage growth. The US CHIPS and Science Act is driving a counter-trend in ultra-pure phosphoric acid demand; Intel's Arizona fab and Samsung's Texas facility will collectively consume a significant amount annually by 2028, requiring dedicated supply agreements with Innophos and Prayon. Canada lacks economic ore, so Nutrien imports merchant acid to blend with potash.
In Europe, production is concentrated in Belgium (Prayon), Finland (Yara), and Russia (PhosAgro), yet the region faces structural decline as zero-liquid-discharge mandates and carbon-border adjustment mechanisms inflate production costs. Europe confronts cost pressure from water-recovery rules and sanctions on Russian supply. Prayon spent USD 85 million in 2024 to reach 95% water recycling, while Russian exports into the bloc fell 80% since 2023. Germany's BASF and France's Timac are testing rare-earth extraction from imported streams to hedge margins.
- Aditya Birla Group
- Agropolychim
- EuroChem Group
- ICL
- IFFCO
- Innophos
- J.R. Simplot Company
- Jordan Phosphate Mines Company, PLC. (JPMC)
- Mosaic
- Nutrien
- OCP
- PhosAgro Group
- Prayon
- Sterlite Copper (A Unit of Vedanta Limited)
- Yara International
- Yuntianhua Co., Ltd.
Additional Benefits:
- The market estimate (ME) sheet in Excel format
- 3 months of analyst support
TABLE OF CONTENTS
1 Introduction
- 1.1 Study Assumptions & Market Definition
- 1.2 Scope of the Study
2 Research Methodology
3 Executive Summary
4 Market Landscape
- 4.1 Market Overview
- 4.2 Market Drivers
- 4.2.1 Fertilizer-grade demand acceleration in food-security programs
- 4.2.2 Processed food & RTD beverage acidulant uptake
- 4.2.3 LiFePO4 battery production & closed-loop recycling
- 4.2.4 High-purity electronics-etch demand in semiconductor fabs
- 4.2.5 Low-grade ore micro-flotation unlocking new capacities
- 4.3 Market Restraints
- 4.3.1 Rock-phosphate supply shocks from Morocco & China
- 4.3.2 Zero-liquid-discharge rules inflating effluent costs
- 4.3.3 Non-phosphate water-treatment chemistries gaining share
- 4.4 Value Chain Analysis
- 4.5 Porter's Five Forces
- 4.5.1 Bargaining Power of Suppliers
- 4.5.2 Bargaining Power of Buyers
- 4.5.3 Threat of New Entrants
- 4.5.4 Threat of Substitutes
- 4.5.5 Competitive Rivalry
- 4.6 Pricing Trend Analysis
5 Market Size and Growth Forecasts (Volume)
- 5.1 By Grade
- 5.1.1 Fertilizer Grade
- 5.1.2 Food Grade
- 5.1.3 Feed Grade
- 5.1.4 Industrial Grade
- 5.1.5 Electronics/Ultra-pure Grade
- 5.2 By Process
- 5.2.1 Wet-Process
- 5.2.2 Thermal-Process
- 5.2.3 Secondary-Source/Recovery
- 5.3 By End-User Industry
- 5.3.1 Fertilizer
- 5.3.2 Food and Beverages
- 5.3.3 Chemicals
- 5.3.4 Medicine
- 5.3.5 Metallurgy
- 5.3.6 Other End-user Industries
- 5.4 By Geography
- 5.4.1 Asia-Pacific
- 5.4.1.1 China
- 5.4.1.2 India
- 5.4.1.3 Japan
- 5.4.1.4 South Korea
- 5.4.1.5 ASEAN
- 5.4.1.6 Rest of Asia-Pacific
- 5.4.2 North America
- 5.4.2.1 United States
- 5.4.2.2 Canada
- 5.4.2.3 Mexico
- 5.4.3 Europe
- 5.4.3.1 Germany
- 5.4.3.2 United Kingdom
- 5.4.3.3 France
- 5.4.3.4 Italy
- 5.4.3.5 Russia
- 5.4.3.6 Rest of Europe
- 5.4.4 South America
- 5.4.4.1 Brazil
- 5.4.4.2 Argentina
- 5.4.4.3 Rest of South America
- 5.4.5 Middle-East and Africa
- 5.4.5.1 Saudi Arabia
- 5.4.5.2 United Arab Emirates
- 5.4.5.3 South Africa
- 5.4.5.4 Egypt
- 5.4.5.5 Rest of Middle-East and Africa
- 5.4.1 Asia-Pacific
6 Competitive Landscape
- 6.1 Market Concentration
- 6.2 Strategic Moves
- 6.3 Market Share(%)/Ranking Analysis
- 6.4 Company Profiles (includes Global level Overview, Market level overview, Core Segments, Financials as available, Strategic Information, Products and Services, and Recent Developments)
- 6.4.1 Aditya Birla Group
- 6.4.2 Agropolychim
- 6.4.3 EuroChem Group
- 6.4.4 ICL
- 6.4.5 IFFCO
- 6.4.6 Innophos
- 6.4.7 J.R. Simplot Company
- 6.4.8 Jordan Phosphate Mines Company, PLC. (JPMC)
- 6.4.9 Mosaic
- 6.4.10 Nutrien
- 6.4.11 OCP
- 6.4.12 PhosAgro Group
- 6.4.13 Prayon
- 6.4.14 Sterlite Copper (A Unit of Vedanta Limited)
- 6.4.15 Yara International
- 6.4.16 Yuntianhua Co., Ltd.
7 Market Opportunities and Future Outlook
- 7.1 Recovery of Rare-Earth Elements from Process Streams
- 7.2 Commercialization of Chiral Phosphoric Acid Catalysts

