PUBLISHER: Mordor Intelligence | PRODUCT CODE: 2124146

PUBLISHER: Mordor Intelligence | PRODUCT CODE: 2124146
Transaction Monitoring - Market Share Analysis, Industry Trends & Statistics, Growth Forecasts (2026 - 2031)
According to Mordor Intelligence, the transaction monitoring market size was valued at USD 19.98 billion in 2025 and estimated to grow from USD 23.13 billion in 2026 to reach USD 48.06 billion by 2031, at a CAGR of 15.74% during the forecast period (2026-2031).
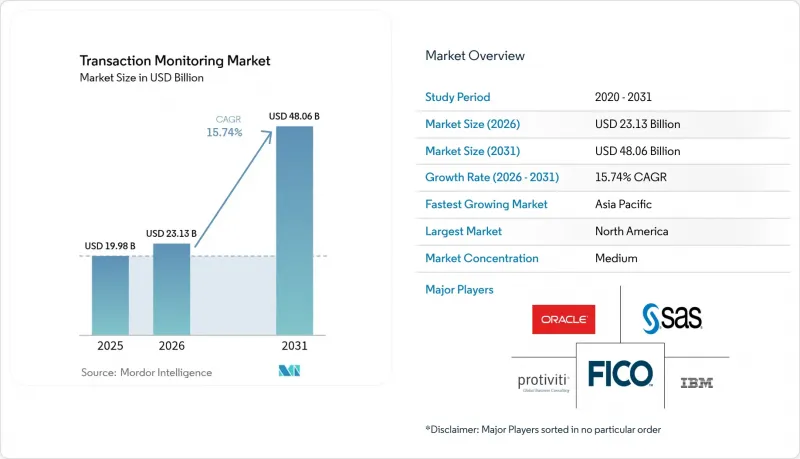
This report is Segmented by Component (Solution and Services) and by Deployment Mode (Cloud, On-Premises), by Application (Anti-Money Laundering, Fraud Detection and Prevention, and More), by Organization Size (Large Enterprises, Small and Medium Enterprises), by Industry Vertical (BFSI, Government and Defense, and More), and by Geography. The Market Forecasts are Provided in Terms of Value (USD).
Global Transaction Monitoring Market Trends and Insights
Stringent AML & KYC regulations
Global AML penalties climbed 31% year on year to USD 263 million in 2024, prompting banks to retire legacy rule sets in favor of adaptive, AI-enabled engines that address the EU 6AMLD and the US Corporate Transparency Act. Institutions deploying advanced models report 40% fewer false positives and materially stronger examiner confidence, speeding case workflows and reducing compliance backlogs.
Digital payments expansion necessitates real-time monitoring
Real-time payment rails demand sub-second scoring, and firms that upgrade monitoring pipelines see a 49% lift in fraud-prevention effectiveness. Retail and e-commerce adopters leverage the same controls to stem loyalty fraud and card-testing attacks, cutting fraud losses by up to 60% while preserving customer experience.
High false-positive alert fatigue
Rule-centric systems still generate above-90% noise ratios, forcing banks to hire large analyst teams and risking missed threats amid alert overload. TD Bank's USD 3 billion penalty underscored the cost of poor triage. AI-powered case managers are cutting false positives by 40%, freeing investigators for high-value reviews.
Other drivers and restraints analyzed in the detailed report include:
- AI and machine learning transform detection accuracy
- CBDC pilots trigger new surveillance mandates
- Synthetic identity fraud evades traditional controls
For complete list of drivers and restraints, kindly check the Table Of Contents.
Segment Analysis
Solutions held 70.85% share in 2025, growing reliance on external expertise signals a shift toward continuous-improvement outsourcing. Specialized providers build recurring revenue around post-implementation optimization, ensuring the transaction monitoring market maintains resilient demand through economic cycles as compliance requirements tighten.
However, Services revenue within the transaction monitoring market is expected to rise at an 18.12% CAGR from 2026-2031 as institutions recognize that technology alone cannot sustain effective compliance. Engagements covering AI-model validation, scenario tuning, and data-quality remediation now accompany most platform deployments, especially for cross-border banks contending with divergent regulator expectations. These advisory and managed-service layers boost precision, delivering up to 30% better threat capture rates.
Cloud platforms accounted for 63.25% of the transaction monitoring market size in 2025 and are projected to grow at 19.28% CAGR through 2031, propelled by elastic throughput and automatic rule updates. Real-time screening across hundreds of millions of transactions has become economically viable for midsize banks and fintechs that previously lacked enterprise-grade infrastructure.
Regulated entities in data-sensitive jurisdictions still blend on-premise cores with cloud analytics, but privacy-enhancing computation is narrowing resistance. As cost-to-serve falls, cloud adoption unlocks adjacent analytics such as customer screening and sanctions testing, reinforcing vendor cross-sell momentum in the transaction monitoring market.
Complete Report Scope:
- By Component
- Solutions
- Services
- By Deployment Mode
- Cloud
- On-Premises
- By Application
- Anti-Money Laundering (AML)
- Fraud Detection and Prevention
- Customer Identity Management
- Compliance Management
- Other Niche Use-Cases
- By Organization Size
- Large Enterprises
- Small and Medium Enterprises (SMEs)
- By Industry Vertical
- Banking, Financial Services and Insurance (BFSI)
- Government and Defence
- IT and Telecom
- Retail and E-commerce
- Healthcare
- Energy and Utilities
- Manufacturing
- Others
- By Geography
- North America
- United States
- Canada
- Mexico
- South America
- Brazil
- Argentina
- Rest of South America
- Europe
- United Kingdom
- Germany
- France
- Italy
- Spain
- Russia
- Rest of Europe
- APAC
- China
- Japan
- India
- South Korea
- Australia and New Zealand
- Rest of APAC
- Middle East and Africa
- Middle East
- GCC
- Turkey
- Rest of Middle East
- Africa
- South Africa
- Nigeria
- Rest of Africa
- Middle East
- North America
Geography Analysis
North America led the transaction monitoring market with a 32.65% share in 2025, supported by FinCEN enforcement activity and sustained technology spending by tier-1 banks. U.S. institutions racing to lower false positives are piloting explainable AI that meets examiner transparency criteria, while Canada's FinTRAC pushes mid-tier lenders to adopt real-time analytics.
Asia-Pacific is projected to post the highest 17.14% CAGR through 2031 as China, India, and Indonesia digitize payment ecosystems at scale. China's central-bank mandates drive domestic vendors to embed continuous monitoring into super-app payment infrastructure, whereas India's UPI ecosystem requires round-the-clock screening to manage micro-transaction volumes. Developed markets such as Japan, South Korea, and Australia focus on AI-based anomaly detection to offset skilled-analyst shortages.
Europe maintains robust growth as 6AMLD harmonizes AML regimes and MiCA extends surveillance to crypto-asset service providers. Germany and France emphasize privacy-preserving analytics to align with GDPR, while the United Kingdom's FCA levies stiff penalties for tuning lapses, accelerating modern-platform adoption. Pan-European open-banking initiatives simultaneously widen data inputs and complexity, reinforcing demand for API-centric solutions across the transaction monitoring market.
- NICE Ltd (Actimize)
- Oracle Corp.
- Fair Isaac Corp (FICO)
- SAS Institute Inc.
- IBM Corp.
- Fidelity National Information Services (FIS)
- Fiserv Inc.
- BAE Systems plc
- ACI Worldwide Inc.
- LexisNexis Risk Solutions
- Protiviti Inc.
- Feedzai Inc.
- ComplyAdvantage Ltd
- FeatureSpace Ltd
- Temenos AG
- Napier AI Ltd
- Tookitaki Holding Pte Ltd
- Fenergo Group
- ThetaRay Ltd
- Silent Eight Pte Ltd
Additional Benefits:
- The market estimate (ME) sheet in Excel format
- 3 months of analyst support
TABLE OF CONTENTS
1 INTRODUCTION
- 1.1 Study Assumptions and Market Definition
- 1.2 Scope of the Study
2 RESEARCH METHODOLOGY
3 EXECUTIVE SUMMARY
4 MARKET LANDSCAPE
- 4.1 Market Overview
- 4.2 Market Drivers
- 4.2.1 Stringent AML and KYC regulations
- 4.2.2 Rising volumes of digital and real-time payments
- 4.2.3 Integration of AI and ML to cut false positives
- 4.2.4 Shift toward cloud-based compliance platforms
- 4.2.5 Open-Banking APIs enabling cross-bank monitoring
- 4.2.6 CBDC pilots triggering new surveillance mandates
- 4.3 Market Restraints
- 4.3.1 High false-positive alert fatigue
- 4.3.2 Shortage of skilled AML data analysts
- 4.3.3 Data-sovereignty and privacy-law friction
- 4.3.4 Surge in synthetic-ID fraud bypassing rules
- 4.4 Value / Supply-Chain Analysis
- 4.5 Regulatory Landscape
- 4.6 Technological Outlook
- 4.7 Information-Sharing Structures by Region
- 4.8 Technology Enablers for Secure Data Sharing
- 4.9 Porter's Five Forces
- 4.9.1 Bargaining Power of Suppliers
- 4.9.2 Bargaining Power of Buyers
- 4.9.3 Threat of New Entrants
- 4.9.4 Threat of Substitutes
- 4.9.5 Competitive Rivalry
5 MARKET SIZE AND GROWTH FORECASTS (VALUE)
- 5.1 By Component
- 5.1.1 Solutions
- 5.1.2 Services
- 5.2 By Deployment Mode
- 5.2.1 Cloud
- 5.2.2 On-Premises
- 5.3 By Application
- 5.3.1 Anti-Money Laundering (AML)
- 5.3.2 Fraud Detection and Prevention
- 5.3.3 Customer Identity Management
- 5.3.4 Compliance Management
- 5.3.5 Other Niche Use-Cases
- 5.4 By Organization Size
- 5.4.1 Large Enterprises
- 5.4.2 Small and Medium Enterprises (SMEs)
- 5.5 By Industry Vertical
- 5.5.1 Banking, Financial Services and Insurance (BFSI)
- 5.5.2 Government and Defence
- 5.5.3 IT and Telecom
- 5.5.4 Retail and E-commerce
- 5.5.5 Healthcare
- 5.5.6 Energy and Utilities
- 5.5.7 Manufacturing
- 5.5.8 Others
- 5.6 By Geography
- 5.6.1 North America
- 5.6.1.1 United States
- 5.6.1.2 Canada
- 5.6.1.3 Mexico
- 5.6.2 South America
- 5.6.2.1 Brazil
- 5.6.2.2 Argentina
- 5.6.2.3 Rest of South America
- 5.6.3 Europe
- 5.6.3.1 United Kingdom
- 5.6.3.2 Germany
- 5.6.3.3 France
- 5.6.3.4 Italy
- 5.6.3.5 Spain
- 5.6.3.6 Russia
- 5.6.3.7 Rest of Europe
- 5.6.4 APAC
- 5.6.4.1 China
- 5.6.4.2 Japan
- 5.6.4.3 India
- 5.6.4.4 South Korea
- 5.6.4.5 Australia and New Zealand
- 5.6.4.6 Rest of APAC
- 5.6.5 Middle East and Africa
- 5.6.5.1 Middle East
- 5.6.5.1.1 GCC
- 5.6.5.1.2 Turkey
- 5.6.5.1.3 Rest of Middle East
- 5.6.5.2 Africa
- 5.6.5.2.1 South Africa
- 5.6.5.2.2 Nigeria
- 5.6.5.2.3 Rest of Africa
- 5.6.5.1 Middle East
- 5.6.1 North America
6 COMPETITIVE LANDSCAPE
- 6.1 Market Concentration
- 6.2 Strategic Moves
- 6.3 Market Share Analysis
- 6.4 Company Profiles (includes Global level Overview, Market level overview, Core Segments, Financials as available, Strategic Information, Market Rank/Share for key companies, Products and Services, and Recent Developments)
- 6.4.1 NICE Ltd (Actimize)
- 6.4.2 Oracle Corp.
- 6.4.3 Fair Isaac Corp (FICO)
- 6.4.4 SAS Institute Inc.
- 6.4.5 IBM Corp.
- 6.4.6 Fidelity National Information Services (FIS)
- 6.4.7 Fiserv Inc.
- 6.4.8 BAE Systems plc
- 6.4.9 ACI Worldwide Inc.
- 6.4.10 LexisNexis Risk Solutions
- 6.4.11 Protiviti Inc.
- 6.4.12 Feedzai Inc.
- 6.4.13 ComplyAdvantage Ltd
- 6.4.14 FeatureSpace Ltd
- 6.4.15 Temenos AG
- 6.4.16 Napier AI Ltd
- 6.4.17 Tookitaki Holding Pte Ltd
- 6.4.18 Fenergo Group
- 6.4.19 ThetaRay Ltd
- 6.4.20 Silent Eight Pte Ltd
7 MARKET OPPORTUNITIES AND FUTURE OUTLOOK
- 7.1 White-space and Unmet-Need Assessment

