PUBLISHER: Mordor Intelligence | PRODUCT CODE: 2124172

PUBLISHER: Mordor Intelligence | PRODUCT CODE: 2124172
Next Generation 3D Display - Market Share Analysis, Industry Trends & Statistics, Growth Forecasts (2026 - 2031)
According to Mordor Intelligence, the next generation 3D display market size was valued at USD 16.48 billion in 2025 and estimated to grow from USD 18.56 billion in 2026 to reach USD 33.59 billion by 2031, at a CAGR of 12.60% during the forecast period (2026-2031).
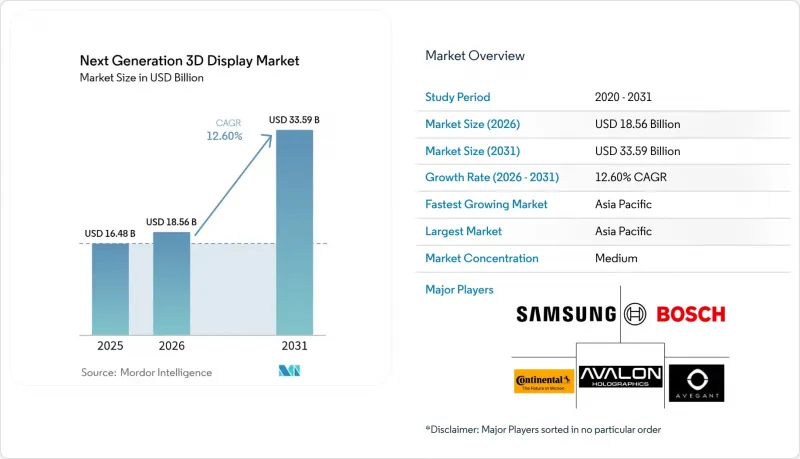
This report is Segmented by Product (3D Holographic Display, Head Mounted Displays (HMD), and More), by Technology (Digital Light Processing Rear-Projection Television (DLP RPTV), LED, and More), by Access Method (Micro Display, Conventional/Screen Based Display), by End User Industry (Consumer Electronics, and More), and by Geography. The Market Forecasts are Provided in Terms of Value (USD).
Global Next Generation 3D Display Market Trends and Insights
Rapid Adoption in Consumer Electronics
Flagship smartphones and tablets now ship with autostereoscopic screens that deliver gaming, e-commerce, and video-chat depth cues without the need for accessories, thereby boosting perceived value in saturated premium segments. Samsung moved more than 2 million glasses-free 3D tablets during H1 2024, validating the mass-market potential of the next generation 3D display market. Chinese brands are integrating light-field modules into foldables, counting on 15-20% price premiums above USD 1,000 devices to offset panel costs. The cost gap between 2D and 3D displays is narrowing as OLED-on-silicon volume scales, enabling tier-1 vendors to treat 3D capability as a default spec for high-end hardware. Retailers report higher conversion rates for 3D product views, incentivizing content ecosystems that, in turn, expand hardware demand.
Automotive HUD Integration Wave
Head-up displays are graduating from planar overlays to volumetric projections that place navigation arrows 10 meters ahead, eliminating driver refocus lag and cutting false-dismiss rates for ADAS alerts. Continental's March 2024 holographic HUD demonstration met ISO 26262 safety requirements and secured program adoption by a German luxury marque. Bosch and its partner OEMs plan to launch micro-LED HUDs by model year 2027, aligning display roadmaps with the rollouts of Level-2+ autonomy. Eye-tracking modules dynamically adjust hologram depth within 10 ms, which demands neural-accelerated controllers and propels silicon-level innovation. These advances reinforce the next-generation 3D display market as a core enabler of safety-critical cockpit experiences.
Lack of 3D Content Standards
With ISO/IEC MPEG-I Part 12 still in draft, manufacturers maintain proprietary pipelines spanning multi-view video, mesh streaming, or light-field encoding. This fragmentation raises production costs 40-60% and slows release cadences, damping device uptake despite robust hardware innovation. SMPTE's 2024 interoperability report remains voluntary, leaving major studios tied to vendor-specific mastering approaches. Streaming platforms struggle to auto-match content with display capabilities because depth-map metadata remains inconsistent, forcing manual curation. Until a consensus codec emerges, the next generation 3D display market faces an availability bottleneck that tempers near-term household penetration.
Other drivers and restraints analyzed in the detailed report include:
- Advancements in OLED and MicroLED Technologies
- Emergence of AI-Generated Holographic Ecosystems
- High Capital Costs of Manufacturing Lines
For complete list of drivers and restraints, kindly check the Table Of Contents.
Segment Analysis
Volumetric displays are forecast to expand at 14.25% annually through 2031, making them the fastest-growing slice of the next-generation 3D display market. Laboratory breakthroughs, such as Light Field Lab's 28-billion-pixel SolidLight pilot, have confirmed commercial viability in retail showcases. Multiple-viewer visibility without glasses reduces fatigue and opens collaborative design, medical imaging, and entertainment scenarios. Stereoscopic formats, despite retaining 41.72% revenue in 2025, face usage-time limits due to accommodative stress studies, which may tilt procurement toward volumetric options. Static volumetric units support radiologists who rotate CT datasets in free space, enhancing anomaly detection compared to 2D monitors. Meanwhile, head-mounted stereoscopic displays stay relevant in gaming and training, where cost ceilings dictate sub-USD 50 panel premiums.
Although holographic tablets remain compute-intensive, edge AI accelerators promise battery-friendly operation by 2027. Automotive OEMs are experimenting with free-space volumetric dashboards to replace conventional clusters, seeking to enhance spatial awareness at highway speeds. Retailers deploy floor-standing volumetric kiosks to display lifelike products without inventory, advancing experiential commerce. Collectively, these deployments propel volumetric formats into mainstream segments of the next generation 3D display market.
OLED-on-silicon shipments are projected to grow at a 13.38% rate through 2031, as near-eye demand in AR headsets, pilot helmets, and surgical scopes accelerates. Pixel-level dimming delivers infinite contrast, crucial for overlaying bright outdoor scenes in aviation and construction. LED panels kept 33.74% of 2025 revenue by dominating stadium-scale walls, yet face pixel-density ceilings that OLED-on-silicon surpasses. MicroLED prototypes now match OLED fidelity while offering burn-in resistance, positioning the technology as a long-term successor once yield climbs. Liquid-crystal variants linger in cost-sensitive digital signage, though narrow viewing angles limit collaborative 3D sessions and cap their influence on the next generation 3D display market.
Foldable tablets utilize flexible OLED substrates to provide 3D depth on large canvases, seamlessly merging portability with spatial immersion. Tandem OLEDs that reach 10,000 nits enable sunlight-readable automotive HUDs without auxiliary reflectors, simplifying optics stacks and reducing cabin heat load. Digital Light Processing rear-projection televisions, once a staple of budget big-screen gaming, are exiting the market as flat-panel advances nullify their size-to-cost edge. Collectively, these shifts consolidate OLED-on-silicon's lead while keeping MicroLED on the strategic roadmap.
Complete Report Scope:
- By Product
- 3D Holographic Display
- Head Mounted Displays
- Static Volume Displays
- Light Field Displays
- Volumetric Displays
- Stereoscopic Displays
- By Technology
- Digital Light Processing Rear-Projection Television (DLP RPTV)
- Light Emitting Diode (LED)
- Organic Light Emitting Diode (OLED)
- Plasma Display Panel (PDP)
- Liquid Crystal Display (LCD)
- MicroLED
- OLED-on-Silicon (OLEDoS)
- By Access Method
- Micro Display
- Conventional/Screen Based Display
- By End User Industry
- Consumer Electronics
- Automotive and Transportation
- Medical
- Aerospace and Defense
- Industrial
- Education and Training
- Retail and Advertising
- By Geography
- North America
- United States
- Canada
- Mexico
- South America
- Brazil
- Argentina
- Rest of South America
- Europe
- Germany
- United Kingdom
- France
- Italy
- Russia
- Rest of Europe
- Asia Pacific
- China
- Japan
- South Korea
- India
- Australia AND New Zealand
- Rest of Asia Pacific
- Middle East
- Saudi Arabia
- United Arab Emirates
- Turkey
- Rest of Middle East
- Africa
- South Africa
- Nigeria
- Egypt
- Rest of Africa
- North America
Geography Analysis
Asia Pacific retained 46.31% of 2025 revenue and advances at a 12.74% CAGR, underpinned by South Korean and Chinese subsidies that derisk micro-display capex and sustain supply-chain scale. South Korea's KRW 500 billion grant pool accelerates OLED-on-silicon and MicroLED pilot lines, placing domestic players at the center of global sourcing strategies. Chinese manufacturers BOE and Tianma scale capacity in Chengdu and Wuhan, reducing import dependence and pricing aggressively to gain global design-ins. Japan pivots toward industrial and medical micro-displays, leveraging precision camera and semiconductor expertise to protect margins in the next generation 3D display market.
North America is driven by the growth of automotive HUD rollouts, military AR procurement, and med-tech innovation, with U.S. defense budgets underpinning the demand for ruggedized headsets. Canada's visual-effects cluster fuels a burgeoning 3D content ecosystem, driving local hardware sales. Europe remains anchored by German and Italian carmakers integrating holographic HUDs and by rigorous health-and-safety regulations that prioritize low-fatigue displays across workplaces. Policy support under Horizon Europe and the European Chips Act drives pilot fab investments, albeit at slower cadence than Asia Pacific.
South America sees early retail and hospitality deployments, notably in Brazil's luxury malls where holographic kiosks elevate brand experiences. The Middle East embraces 3D screens in destination shopping centers and smart-city initiatives, backed by sovereign wealth capital. African adoption stays limited by cost and infrastructure, though South Africa and Nigeria begin corporate rollouts, positioning the continent for gradual inclusion in the next generation 3D display market.
- Avalon Holographics Inc.
- Avegant Corporation
- Robert Bosch GmbH
- Continental Aktiengesellschaft
- Fovi3D Inc.
- Samsung Electronics Co., Ltd.
- NVIDIA Corporation
- Google LLC
- Coretronic Corporation
- Creal 3D SA
- Sharp Corporation
- LG Electronics Inc.
- AU Optronics Corp.
- Panasonic Holdings Corporation
- Sony Group Corporation
- Light Field Lab Inc.
- Looking Glass Factory Inc.
- Voxon Photonics Pty Ltd
- RealView Imaging Ltd.
- HYPERVSN Limited
- Holoxica Limited
- Leia Inc.
- Microsoft Corporation
Additional Benefits:
- The market estimate (ME) sheet in Excel format
- 3 months of analyst support
TABLE OF CONTENTS
1 INTRODUCTION
- 1.1 Study Assumptions and Market Definition
- 1.2 Scope of the Study
2 RESEARCH METHODOLOGY
3 EXECUTIVE SUMMARY
4 MARKET LANDSCAPE
- 4.1 Market Overview
- 4.2 Market Drivers
- 4.2.1 Rapid adoption in consumer electronics
- 4.2.2 Automotive HUD integration wave
- 4.2.3 Advancements in OLED and MicroLED technologies
- 4.2.4 Emergence of AI-generated holographic content ecosystems
- 4.2.5 Government incentives for domestic micro-display fabs
- 4.2.6 Growing use in tele-medicine surgical planning
- 4.3 Market Restraints
- 4.3.1 Lack of 3D content standards
- 4.3.2 High capital costs of manufacturing lines
- 4.3.3 Occupational-health concerns on VAC conflict
- 4.3.4 Supply-chain dependency on rare-earth phosphors
- 4.4 Industry Value Chain Analysis
- 4.5 Impact of Macroeconomic Factors
- 4.6 Regulatory Landscape
- 4.7 Technological Outlook
- 4.8 Porter's Five Forces Analysis
- 4.8.1 Bargaining Power of Suppliers
- 4.8.2 Bargaining Power of Consumers
- 4.8.3 Threat of New Entrants
- 4.8.4 Threat of Substitutes
- 4.8.5 Intensity of Competitive Rivalry
5 MARKET SIZE AND GROWTH FORECASTS (VALUE)
- 5.1 By Product
- 5.1.1 3D Holographic Display
- 5.1.2 Head Mounted Displays
- 5.1.3 Static Volume Displays
- 5.1.4 Light Field Displays
- 5.1.5 Volumetric Displays
- 5.1.6 Stereoscopic Displays
- 5.2 By Technology
- 5.2.1 Digital Light Processing Rear-Projection Television (DLP RPTV)
- 5.2.2 Light Emitting Diode (LED)
- 5.2.3 Organic Light Emitting Diode (OLED)
- 5.2.4 Plasma Display Panel (PDP)
- 5.2.5 Liquid Crystal Display (LCD)
- 5.2.6 MicroLED
- 5.2.7 OLED-on-Silicon (OLEDoS)
- 5.3 By Access Method
- 5.3.1 Micro Display
- 5.3.2 Conventional/Screen Based Display
- 5.4 By End User Industry
- 5.4.1 Consumer Electronics
- 5.4.2 Automotive and Transportation
- 5.4.3 Medical
- 5.4.4 Aerospace and Defense
- 5.4.5 Industrial
- 5.4.6 Education and Training
- 5.4.7 Retail and Advertising
- 5.5 By Geography
- 5.5.1 North America
- 5.5.1.1 United States
- 5.5.1.2 Canada
- 5.5.1.3 Mexico
- 5.5.2 South America
- 5.5.2.1 Brazil
- 5.5.2.2 Argentina
- 5.5.2.3 Rest of South America
- 5.5.3 Europe
- 5.5.3.1 Germany
- 5.5.3.2 United Kingdom
- 5.5.3.3 France
- 5.5.3.4 Italy
- 5.5.3.5 Russia
- 5.5.3.6 Rest of Europe
- 5.5.4 Asia Pacific
- 5.5.4.1 China
- 5.5.4.2 Japan
- 5.5.4.3 South Korea
- 5.5.4.4 India
- 5.5.4.5 Australia AND New Zealand
- 5.5.4.6 Rest of Asia Pacific
- 5.5.5 Middle East
- 5.5.5.1 Saudi Arabia
- 5.5.5.2 United Arab Emirates
- 5.5.5.3 Turkey
- 5.5.5.4 Rest of Middle East
- 5.5.6 Africa
- 5.5.6.1 South Africa
- 5.5.6.2 Nigeria
- 5.5.6.3 Egypt
- 5.5.6.4 Rest of Africa
- 5.5.1 North America
6 COMPETITIVE LANDSCAPE
- 6.1 Market Concentration
- 6.2 Strategic Moves
- 6.3 Market Share Analysis
- 6.4 Company Profiles (includes Global level Overview, Market level overview, Core Segments, Financials as available, Strategic Information, Market Rank/Share for key companies, Products AND Services, and Recent Developments)
- 6.4.1 Avalon Holographics Inc.
- 6.4.2 Avegant Corporation
- 6.4.3 Robert Bosch GmbH
- 6.4.4 Continental Aktiengesellschaft
- 6.4.5 Fovi3D Inc.
- 6.4.6 Samsung Electronics Co., Ltd.
- 6.4.7 NVIDIA Corporation
- 6.4.8 Google LLC
- 6.4.9 Coretronic Corporation
- 6.4.10 Creal 3D SA
- 6.4.11 Sharp Corporation
- 6.4.12 LG Electronics Inc.
- 6.4.13 AU Optronics Corp.
- 6.4.14 Panasonic Holdings Corporation
- 6.4.15 Sony Group Corporation
- 6.4.16 Light Field Lab Inc.
- 6.4.17 Looking Glass Factory Inc.
- 6.4.18 Voxon Photonics Pty Ltd
- 6.4.19 RealView Imaging Ltd.
- 6.4.20 HYPERVSN Limited
- 6.4.21 Holoxica Limited
- 6.4.22 Leia Inc.
- 6.4.23 Microsoft Corporation
7 MARKET OPPORTUNITIES AND FUTURE OUTLOOK
- 7.1 White-space and unmet-need assessment

