PUBLISHER: Mordor Intelligence | PRODUCT CODE: 2124387

PUBLISHER: Mordor Intelligence | PRODUCT CODE: 2124387
Procurement Analytics - Market Share Analysis, Industry Trends & Statistics, Growth Forecasts (2026 - 2031)
According to Mordor Intelligence, procurement analytics market size in 2026 is estimated at USD 7.11 billion, growing from 2025 value of USD 5.74 billion with 2031 projections showing USD 20.72 billion, growing at 23.85% CAGR over 2026-2031.
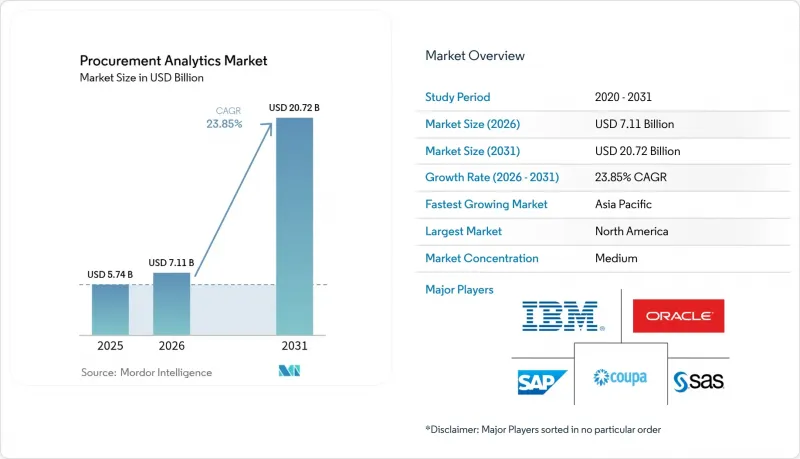
This report is Segmented by Type (Software and Services), Deployment (On-Premise and Cloud), Application (Spend Analytics, Risk Analytics, Supply Chain Analytics, and More), End-User Industry (Manufacturing, Transportation and Logistic, Retail and E-Commerce, and More), Organization Size (Large Enterprises and Small and Medium Enterprises), and Geography. The Market Forecasts are Provided in Terms of Value (USD).
Global Procurement Analytics Market Trends and Insights
SaaS-first procurement-suite road-maps
Companies are retiring fragmented on-premise tools in favor of unified, cloud-native suites that scale on demand, enable organization-wide spend visibility, and accelerate analytics roll-out schedules. Adoption momentum is most evident among mid-market firms that lacked the capital for enterprise-grade infrastructure, yet now benefit from subscription pricing and automated updates. Once operational, these platforms consolidate disparate data sources, laying the groundwork for machine-learning models that optimize sourcing events and monitor compliance in real time. Vendors that bundle prebuilt connectors and low-code interfaces are gaining an edge because they shorten time-to-value and minimize reliance on scarce integration talent.
Generative-AI copilots embedded in source-to-pay
Generative AI modules embedded inside requisition, contract, and supplier-performance workflows are transforming procurement from reactive to insight-led operations. Fortune-500 adopters report double-digit cuts in processing time after letting AI draft sourcing documents, classify open-text spend, and surface negotiation levers. Nevertheless, only a minority of enterprises allow unrestricted model access because sensitive commercial data requires rigorous governance. Vendors are responding by shipping policy-based access controls, localized language models, and in-platform redaction features that satisfy data-protection officers without stalling innovation.
Shortage of procurement-data engineers
Fifty-eight percent of enterprises struggle to recruit analytics talent who grasp both data-engineering principles and category-management nuances. The scarcity inflates wage bills and prolongs deployment cycles as over-extended teams juggle cleansing, normalization, and model-maintenance tasks. Some firms offset the gap by adopting low-code data-pipelines or outsourcing model-build projects to vendors, yet knowledge transfer remains a persistent bottleneck.
Other drivers and restraints analyzed in the detailed report include:
- Cloud-native TCO economics for mid-market buyers
- ESG-linked supplier scoring mandates
- "Shadow IT" spend outside ERP integration
For complete list of drivers and restraints, kindly check the Table Of Contents.
Segment Analysis
Services held a comparatively small revenue base but are rising at 26.45% CAGR, outpacing platform growth as enterprises acknowledge that skilled implementation drives sustained outcomes. Advisory teams perform data-model tuning, supplier-onboarding, and change-management workshops that customers cannot replicate internally. Johnson Controls' global roll-out, which linked 800 suppliers across 14 plants, underscored the scale of integration work required. The procurement analytics market size for services is therefore projected to expand rapidly, even though software retains a 70.62% share. Cross-training initiatives, best-practice libraries, and outcome-based pricing models are further boosting service uptake by aligning fees with realized savings.Platform providers continue reinforcing self-service configuration wizards, yet growing data-quality expectations keep professional services in demand. Vendors with embedded advisory arms can monetize both license and services streams, while pure-play consultancies specialize in complex ERP co-existence or multi-lingual supplier-enablement campaigns. As platform functionality standardizes, differentiation tilts toward implementation accelerators and domain-specific playbooks that cut time-to-value.
Cloud accounts for 64.35% of 2025 revenue, confirming its status as the dominant delivery model for the procurement analytics market. The economics improve when factoring in avoided hardware refreshes, automated patching, and usage-based scaling. Weinor's adoption of a cloud suite trimmed requisition cycle times by up to 41%, equating to a full-time employee's productivity gain. On-premise persists in regulated verticals that mandate local data residency, but even these buyers favor hybrid models that host sensitive records in private clouds while consuming AI engines from public clouds.Edge-ready architecture is emerging as a differentiator, enabling near-real-time analytics at factory sites with intermittent connectivity. Vendors that pre-certify with hyperscalers and colocation providers accelerate customer deployments while satisfying sovereignty constraints. Consequently, the procurement analytics market share of cloud deployments is set to widen further as smaller firms leapfrog on-premise generations altogether.
Complete Report Scope:
- By Type
- Software
- Services
- By Deployment
- On-Premise
- Cloud
- By Application
- Spend Analytics
- Risk Analytics
- Supply Chain Analytics
- Contract Management
- Demand Forecasting
- Supplier Performance Management
- By End-user Industry
- Manufacturing
- Transportation and Logistics
- Retail and E-commerce
- BFSI
- IT and Telecommunication
- Healthcare and Life Sciences
- Energy and Utilities
- Other End-user Industries
- By Organization Size
- Large Enterprises
- Small and Medium Enterprises (SMEs)
- By Geography
- North America
- United States
- Canada
- Mexico
- South America
- Brazil
- Argentina
- Chile
- Rest of South America
- Europe
- Germany
- United Kingdom
- France
- Italy
- Spain
- Russia
- Rest of Europe
- Asia-Pacific
- China
- Japan
- India
- South Korea
- Singapore
- Malaysia
- Australia
- Rest of Asia-Pacific
- Middle East and Africa
- Middle East
- Saudi Arabia
- United Arab Emirates
- Turkey
- Rest of Middle East
- Africa
- South Africa
- Nigeria
- Egypt
- Rest of Africa
- Middle East
- North America
Geography Analysis
North America led the procurement analytics market with 36.95% revenue in 2025. Mature cloud infrastructure, a dense ecosystem of specialized service providers, and continued tariff uncertainty encourage enterprises to invest in real-time cost-modeling engines. Universities and utilities confirm that more than 60% of their suppliers express tariff-related concerns, pushing buyers to deploy scenario-planning dashboards. Federal incentives for reshoring critical materials add another dimension, requiring analytics that integrate subsidy tracking and local-content thresholds.Asia-Pacific delivers 26.10% CAGR due to manufacturing-led digitization and supportive e-governance programs. Asia-Pacific posts the fastest growth. Government-led manufacturing 4.0 grants in China and South-East Asia subsidize automation that pairs machine-data streams with procurement KPIs. Multinational OEMs locate sourcing centers in Singapore to tap its cloud-first regulations, then extend shared services across ASEAN plants. Japanese conglomerates, historically cautious about public-cloud workloads, are adopting sovereign-cloud zones that satisfy domestic privacy statutes while enabling AI model training on multi-year purchasing archives.Europe ranks close behind North America in absolute spend. ESG compliance drives analytics to the boardroom, where supply-chain transparency becomes as strategic as price savings. France's digital-sovereignty charter propels demand for regionally hosted suites, while the United Kingdom's post-Brexit customs landscape amplifies the need for harmonized tariff-classification tools. Eastern European manufacturers, aiming to capture near-shoring contracts, invest in risk-analytics modules that quantify geopolitical exposure and logistics lead-time variability.
- SAP SE
- Oracle Corporation
- IBM Corporation
- SAS Institute Inc.
- Coupa Software Inc.
- Zycus Inc.
- Jaggaer LLC
- GEP Worldwide LLC
- Ivalua Inc.
- Basware Oyj
- Sievo Oy
- SpendHQ LLC
- Proactis Holdings PLC
- Rosslyn Data Technologies PLC
- Simfoni Analytics Ltd.
- Spendscape by McKinsey
- Bridgei2i Analytics Solutions
- Genpact Ltd.
- Accenture PLC
- Deloitte Touche Tohmatsu Ltd.
- Infosys Ltd.
- Capgemini SE
- WNS Global Services
- Xoomworks Procurement
- Infor Inc.
Additional Benefits:
- The market estimate (ME) sheet in Excel format
- 3 months of analyst support
TABLE OF CONTENTS
1 INTRODUCTION
- 1.1 Study Assumptions and Market Definition
- 1.2 Scope of the Study
2 RESEARCH METHODOLOGY
3 EXECUTIVE SUMMARY
4 MARKET LANDSCAPE
- 4.1 Market Overview
- 4.2 Market Drivers
- 4.2.1 SaaS-first procurement-suite road-maps
- 4.2.2 Generative-AI copilots embedded in Source-to-Pay
- 4.2.3 Cloud-native TCO economics for mid-market buyers
- 4.2.4 ESG-linked supplier scoring mandates
- 4.2.5 Predictive risk analytics for near-shoring strategies
- 4.2.6 Autonomous purchasing bots for tail-spend
- 4.3 Market Restraints
- 4.3.1 Shortage of procurement-data engineers
- 4.3.2 "Shadow IT" spend outside ERP integration
- 4.3.3 Data-sovereignty regulations limiting cross-border hosting
- 4.3.4 Multi-tenant cost models challenged by Gen-AI GPU pricing
- 4.4 Industry Value Chain Analysis
- 4.5 Technological Outlook
- 4.6 Regulatory Landscape
- 4.7 Industry Attractiveness - Porter's Five Forces Analysis
- 4.7.1 Bargaining Power of Suppliers
- 4.7.2 Bargaining Power of Buyers
- 4.7.3 Threat of New Entrants
- 4.7.4 Threat of Substitutes
- 4.7.5 Intensity of Competitive Rivalry
- 4.8 Impact of Macroeconomic Factors on the Market
5 MARKET SIZE AND GROWTH FORECASTS (VALUES)
- 5.1 By Type
- 5.1.1 Software
- 5.1.2 Services
- 5.2 By Deployment
- 5.2.1 On-Premise
- 5.2.2 Cloud
- 5.3 By Application
- 5.3.1 Spend Analytics
- 5.3.2 Risk Analytics
- 5.3.3 Supply Chain Analytics
- 5.3.4 Contract Management
- 5.3.5 Demand Forecasting
- 5.3.6 Supplier Performance Management
- 5.4 By End-user Industry
- 5.4.1 Manufacturing
- 5.4.2 Transportation and Logistics
- 5.4.3 Retail and E-commerce
- 5.4.4 BFSI
- 5.4.5 IT and Telecommunication
- 5.4.6 Healthcare and Life Sciences
- 5.4.7 Energy and Utilities
- 5.4.8 Other End-user Industries
- 5.5 By Organization Size
- 5.5.1 Large Enterprises
- 5.5.2 Small and Medium Enterprises (SMEs)
- 5.6 By Geography
- 5.6.1 North America
- 5.6.1.1 United States
- 5.6.1.2 Canada
- 5.6.1.3 Mexico
- 5.6.2 South America
- 5.6.2.1 Brazil
- 5.6.2.2 Argentina
- 5.6.2.3 Chile
- 5.6.2.4 Rest of South America
- 5.6.3 Europe
- 5.6.3.1 Germany
- 5.6.3.2 United Kingdom
- 5.6.3.3 France
- 5.6.3.4 Italy
- 5.6.3.5 Spain
- 5.6.3.6 Russia
- 5.6.3.7 Rest of Europe
- 5.6.4 Asia-Pacific
- 5.6.4.1 China
- 5.6.4.2 Japan
- 5.6.4.3 India
- 5.6.4.4 South Korea
- 5.6.4.5 Singapore
- 5.6.4.6 Malaysia
- 5.6.4.7 Australia
- 5.6.4.8 Rest of Asia-Pacific
- 5.6.5 Middle East and Africa
- 5.6.5.1 Middle East
- 5.6.5.1.1 Saudi Arabia
- 5.6.5.1.2 United Arab Emirates
- 5.6.5.1.3 Turkey
- 5.6.5.1.4 Rest of Middle East
- 5.6.5.2 Africa
- 5.6.5.2.1 South Africa
- 5.6.5.2.2 Nigeria
- 5.6.5.2.3 Egypt
- 5.6.5.2.4 Rest of Africa
- 5.6.5.1 Middle East
- 5.6.1 North America
6 COMPETITIVE LANDSCAPE
- 6.1 Market Concentration
- 6.2 Strategic Moves
- 6.3 Market Share Analysis
- 6.4 Company Profiles (includes Global level Overview, Market level overview, Core Segments, Financials as available, Strategic Information, Market Rank/Share for key companies, Products and Services, and Recent Developments)
- 6.4.1 SAP SE
- 6.4.2 Oracle Corporation
- 6.4.3 IBM Corporation
- 6.4.4 SAS Institute Inc.
- 6.4.5 Coupa Software Inc.
- 6.4.6 Zycus Inc.
- 6.4.7 Jaggaer LLC
- 6.4.8 GEP Worldwide LLC
- 6.4.9 Ivalua Inc.
- 6.4.10 Basware Oyj
- 6.4.11 Sievo Oy
- 6.4.12 SpendHQ LLC
- 6.4.13 Proactis Holdings PLC
- 6.4.14 Rosslyn Data Technologies PLC
- 6.4.15 Simfoni Analytics Ltd.
- 6.4.16 Spendscape by McKinsey
- 6.4.17 Bridgei2i Analytics Solutions
- 6.4.18 Genpact Ltd.
- 6.4.19 Accenture PLC
- 6.4.20 Deloitte Touche Tohmatsu Ltd.
- 6.4.21 Infosys Ltd.
- 6.4.22 Capgemini SE
- 6.4.23 WNS Global Services
- 6.4.24 Xoomworks Procurement
- 6.4.25 Infor Inc.
7 MARKET OPPORTUNITIES AND FUTURE TRENDS
- 7.1 White-Space and Unmet-Need Assessment

