PUBLISHER: Mordor Intelligence | PRODUCT CODE: 2124393

PUBLISHER: Mordor Intelligence | PRODUCT CODE: 2124393
AI In IoT - Market Share Analysis, Industry Trends & Statistics, Growth Forecasts (2026 - 2031)
According to Mordor Intelligence, the AI in IoT market size was valued at USD 60.71 billion in 2025 and estimated to grow from USD 74.04 billion in 2026 to reach USD 199.46 billion by 2031, at a CAGR of 21.95% during the forecast period (2026-2031).
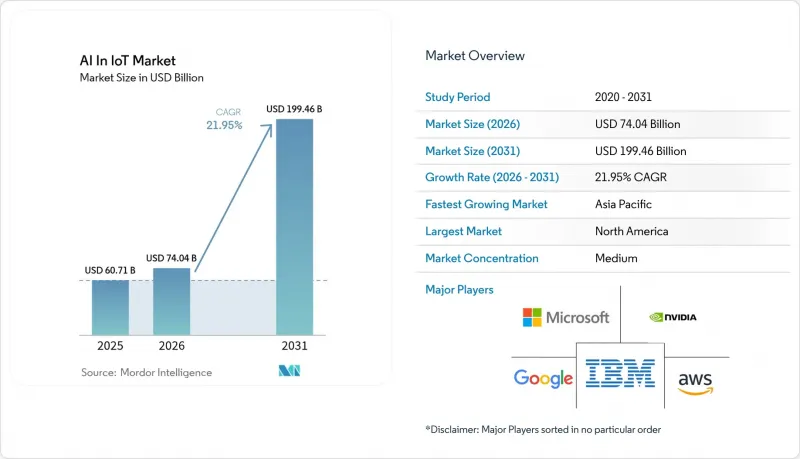
This report is Segmented by Component (Software and Services), Deployment Mode (On-Premises and Cloud), Technology (Machine Learning and Deep Learning, Natural Language Processing, and More), Iot Connectivity Type (Cellular, LPWAN, and More), End-User Vertical (Manufacturing, Energy and Utilities, and More), and Geography.
Global AI In IoT Market Trends and Insights
Rising Big-Data Volumes Generated by Connected Devices
IoT end-points will create about 80 zettabytes of data in 2025, with industrial sensors contributing 73.1 zettabytes. Processing this torrent in the cloud alone strains bandwidth budgets, so manufacturers are adopting edge AI that compresses and analyses streams on-site, trimming network costs and meeting sub-second response targets for quality control. Early movers report double-digit productivity gains after shifting critical analytics to smart controllers embedded in production lines. The pattern is spreading across logistics hubs and utilities where local inference prevents expensive back-haul of raw sensor feeds.
Demand for Real-Time AI Analytics to Monetise IoT Data
Retail banks, power traders and city transit operators note that insight loses value with every second of delay. Deployments now focus on turning live sensor readings into instant price optimisation, routing changes or safety alerts that directly lift revenue or cut penalties. Generative algorithms embedded on gateways are guiding warehouse staff, adjusting robotic paths and fine-tuning inventory in minutes instead of days. The emphasis on time-sensitive monetisation is accelerating pilot-to-production cycles for edge AI platforms across developed economies.
Data-Security and Privacy Gaps Across Heterogeneous IoT Nodes
Diverse device capabilities leave weakest-link gaps that adversaries exploit. A ScienceDirect review shows legacy sensors often lack secure boot or hardware roots of trust, exposing AI models to tampering. The EU Artificial Intelligence Act compels risk audits and encryption upgrades, adding compliance delays and budget overruns. Vendors respond with zero-trust frameworks and on-device anomaly detection, yet lifecycle patching remains arduous for fleets exceeding millions of assets.
Other drivers and restraints analyzed in the detailed report include:
- Edge-AI Chipsets Lowering Latency and Energy Use
- 5G-NTN Convergence Unlocking Remote AIoT Deployments
- Scarcity of AIoT-Skilled Talent and High Integration Costs
For complete list of drivers and restraints, kindly check the Table Of Contents.
Segment Analysis
Software commanded 67.88% revenue in 2025, confirming that algorithms, middleware, and analytics engines drive most value creation within the AI in IoT market. Services expand at a 23.6% CAGR because enterprises outsource model tuning, device onboarding, and lifecycle monitoring. This surge fosters ecosystem consolidation around hyperscale platforms that bundle streaming analytics, edge orchestration, and zero-trust security. The AI in IoT market size for services-linked offerings is projected to expand quickly as companies prioritise managed uptime commitments. Meanwhile, licensing models for specialised inference engines are shifting toward subscription bundles aligned with device counts rather than perpetual fees, smoothing budgets yet locking customers into vendor roadmaps.
Second-generation application-management suites now automate model retraining based on concept drift while device-management portals push differential updates that limit downtime. Security layers grow more sophisticated, adding automated threat hunting that cross-correlates anomalies across fleets. These trends encourage hardware-agnostic architectures so customers can mix gateway brands without rewriting analytics pipelines. Commercial open-source cores joined with proprietary optimisation libraries balance transparency with performance, meeting stringent audit requirements.
On-premises deployments held a 70.65% share in 2025 because manufacturers and hospitals safeguard sensitive data and guarantee deterministic latency. Still, cloud workloads scale faster at 23.9% CAGR, reflecting a swing toward hybrid patterns where local inference feeds anonymised summaries to cloud clusters for heavy training tasks. The AI in IoT market benefits when enterprises keep personally identifiable data inside regulated facilities, yet exploit elastic graphics processing in hyperscale regions for seasonal retraining. Such dual-tier topologies reduce capital expense on local servers while preserving compliance objectives.
Edge gateways increasingly host containerised microservices that tunnel securely to public clouds for orchestration. This set-up lets operators update vision models nightly without halting production lines. Financial services firms adopt similar blueprints, storing individual transaction details on-site but leveraging cloud-resident large-language models to analyse aggregate trends. Cloud providers encourage the shift with private-link offerings that avoid the public internet and supply hardware-rooted confidential-computing enclaves.
Complete Report Scope:
- By Component
- Software
- Application Management
- Connectivity Management
- Device Management
- Data Management
- Network Bandwidth Management
- Real-time Streaming Analytics
- Remote Monitoring
- Security
- Edge Solution
- Services
- Managed Services
- Professional Services
- Software
- By Deployment Mode
- On-premises
- Cloud
- By Technology
- Machine Learning and Deep Learning
- Natural Language Processing
- Computer Vision
- Context-Aware Computing
- By IoT Connectivity Type
- Cellular (2G-5G)
- LPWAN (LoRa, NB-IoT, Sigfox)
- Satellite / NTN
- Short-range (Wi-Fi, BLE, Zigbee)
- By End-user Vertical
- Manufacturing
- Energy and Utilities
- Healthcare
- BFSI
- IT and Telecom
- Transportation and Mobility
- Government
- Retail and e-Commerce
- Agriculture
- By Geography
- North America
- United States
- Canada
- Mexico
- Europe
- Germany
- United Kingdom
- France
- Italy
- Spain
- Russia
- Rest of Europe
- Asia-Pacific
- China
- Japan
- India
- South Korea
- ASEAN
- Australia and New Zealand
- Rest of Asia-Pacific
- South America
- Brazil
- Argentina
- Rest of South America
- Middle East and Africa
- Middle East
- Saudi Arabia
- UAE
- Turkey
- Rest of Middle East
- Africa
- South Africa
- Nigeria
- Rest of Africa
- Middle East
- North America
Geography Analysis
North America controlled 41.60% of revenue in 2025, powered by robust venture backing, extensive 5G roll-outs, and favourable intellectual property regimes. AWS alone budgeted more than USD 100 billion for new AI infrastructure in 2025, ensuring customers have low-friction access to high-performance compute. Federal programmes that fast-track smart port and defence projects further stimulate demand. Nevertheless, wage inflation and talent shortages temper the regional growth rate compared with emerging markets.
Asia-Pacific records the highest 23.0% CAGR through 2031. Chinese vendors integrate vertically from device silicon to cloud dashboards, compressing costs and accelerating iteration cycles. Japan and South Korea pair world-class robotics with dense nationwide 5G to commercialise real-time industrial vision. Government-funded smart-city schemes from India to Indonesia channel subsidies toward start-ups building traffic-monitoring, waste-sorting, and flood-alert systems. The AI in IoT market size for Asia-Pacific eclipses other regions in unit volumes, even though average selling prices remain lower.
Europe advances steadily as the Artificial Intelligence Act clarifies obligations and unlocks capital budgets despite adding compliance steps. Germany spearheads predictive maintenance in automotive lines, while the Netherlands pilots edge AI to control canal water levels. Data-sovereignty rules push enterprises to adopt on-premises and edge configurations, stimulating demand for confidential-computing processors. Middle East and Africa see early traction in oil-field surveillance and smart irrigation, where satellite backhaul circumvents sparse terrestrial coverage. Implementation pace is modest while local skills pipelines build up.
- Amazon Web Services
- Microsoft
- IBM
- Oracle
- Cisco Systems
- NVIDIA
- Siemens
- Bosch.IO
- ARM
- Qualcomm
- Intel
- Huawei
- Schneider Electric
- Honeywell
- PTC
- SAS Institute
- General Electric
- Hitachi
- Salesforce
Additional Benefits:
- The market estimate (ME) sheet in Excel format
- 3 months of analyst support
TABLE OF CONTENTS
1 INTRODUCTION
- 1.1 Study Assumptions and Market Definition
- 1.2 Scope of the Study
2 RESEARCH METHODOLOGY
3 EXECUTIVE SUMMARY
4 MARKET LANDSCAPE
- 4.1 Market Overview
- 4.2 Market Drivers
- 4.2.1 Rising big-data volumes generated by connected devices
- 4.2.2 Demand for real-time AI analytics to monetize IoT data
- 4.2.3 Edge-AI chipsets lowering latency and energy use
- 4.2.4 5G-NTN convergence unlocking remote AIoT deployments
- 4.2.5 Sustainability-linked regulations driving AI-optimised energy use
- 4.2.6 Predictive-maintenance push for supply-chain resilience
- 4.3 Market Restraints
- 4.3.1 Data-security and privacy gaps across heterogeneous IoT nodes
- 4.3.2 Scarcity of AIoT-skilled talent and high integration costs
- 4.3.3 Fragmented standards limiting model portability
- 4.3.4 Looming post-quantum threats to device cryptography
- 4.4 Value Chain Analysis
- 4.5 Regulatory Landscape
- 4.6 Technological Outlook
- 4.7 Porter's Five Forces Analysis
- 4.7.1 Bargaining Power of Suppliers
- 4.7.2 Bargaining Power of Buyers
- 4.7.3 Threat of New Entrants
- 4.7.4 Threat of Substitutes
- 4.7.5 Intensity of Competitive Rivalry
- 4.8 Assessment of the Impact of Macroeconomic Trends on the Market
5 MARKET SIZE AND GROWTH FORECASTS (VALUE)
- 5.1 By Component
- 5.1.1 Software
- 5.1.1.1 Application Management
- 5.1.1.2 Connectivity Management
- 5.1.1.3 Device Management
- 5.1.1.4 Data Management
- 5.1.1.5 Network Bandwidth Management
- 5.1.1.6 Real-time Streaming Analytics
- 5.1.1.7 Remote Monitoring
- 5.1.1.8 Security
- 5.1.1.9 Edge Solution
- 5.1.2 Services
- 5.1.2.1 Managed Services
- 5.1.2.2 Professional Services
- 5.1.1 Software
- 5.2 By Deployment Mode
- 5.2.1 On-premises
- 5.2.2 Cloud
- 5.3 By Technology
- 5.3.1 Machine Learning and Deep Learning
- 5.3.2 Natural Language Processing
- 5.3.3 Computer Vision
- 5.3.4 Context-Aware Computing
- 5.4 By IoT Connectivity Type
- 5.4.1 Cellular (2G-5G)
- 5.4.2 LPWAN (LoRa, NB-IoT, Sigfox)
- 5.4.3 Satellite / NTN
- 5.4.4 Short-range (Wi-Fi, BLE, Zigbee)
- 5.5 By End-user Vertical
- 5.5.1 Manufacturing
- 5.5.2 Energy and Utilities
- 5.5.3 Healthcare
- 5.5.4 BFSI
- 5.5.5 IT and Telecom
- 5.5.6 Transportation and Mobility
- 5.5.7 Government
- 5.5.8 Retail and e-Commerce
- 5.5.9 Agriculture
- 5.6 By Geography
- 5.6.1 North America
- 5.6.1.1 United States
- 5.6.1.2 Canada
- 5.6.1.3 Mexico
- 5.6.2 Europe
- 5.6.2.1 Germany
- 5.6.2.2 United Kingdom
- 5.6.2.3 France
- 5.6.2.4 Italy
- 5.6.2.5 Spain
- 5.6.2.6 Russia
- 5.6.2.7 Rest of Europe
- 5.6.3 Asia-Pacific
- 5.6.3.1 China
- 5.6.3.2 Japan
- 5.6.3.3 India
- 5.6.3.4 South Korea
- 5.6.3.5 ASEAN
- 5.6.3.6 Australia and New Zealand
- 5.6.3.7 Rest of Asia-Pacific
- 5.6.4 South America
- 5.6.4.1 Brazil
- 5.6.4.2 Argentina
- 5.6.4.3 Rest of South America
- 5.6.5 Middle East and Africa
- 5.6.5.1 Middle East
- 5.6.5.1.1 Saudi Arabia
- 5.6.5.1.2 UAE
- 5.6.5.1.3 Turkey
- 5.6.5.1.4 Rest of Middle East
- 5.6.5.2 Africa
- 5.6.5.2.1 South Africa
- 5.6.5.2.2 Nigeria
- 5.6.5.2.3 Rest of Africa
- 5.6.5.1 Middle East
- 5.6.1 North America
6 COMPETITIVE LANDSCAPE
- 6.1 Market Concentration
- 6.2 Strategic Moves
- 6.3 Market Share Analysis
- 6.4 Company Profiles (includes Global level Overview, Market level overview, Core Segments, Financials as available, Strategic Information, Market Rank/Share for key companies, Products and Services, and Recent Developments)
- 6.4.1 Amazon Web Services
- 6.4.2 Microsoft
- 6.4.3 IBM
- 6.4.4 Google
- 6.4.5 Oracle
- 6.4.6 Cisco Systems
- 6.4.7 NVIDIA
- 6.4.8 Siemens
- 6.4.9 Bosch.IO
- 6.4.10 ARM
- 6.4.11 Qualcomm
- 6.4.12 Intel
- 6.4.13 Huawei
- 6.4.14 Schneider Electric
- 6.4.15 Honeywell
- 6.4.16 PTC
- 6.4.17 SAS Institute
- 6.4.18 General Electric
- 6.4.19 Hitachi
- 6.4.20 Salesforce
7 MARKET OPPORTUNITIES AND FUTURE OUTLOOK
- 7.1 White-space and Unmet-Need Assessment

