PUBLISHER: Mordor Intelligence | PRODUCT CODE: 2124394

PUBLISHER: Mordor Intelligence | PRODUCT CODE: 2124394
Multi-Touch Attribution - Market Share Analysis, Industry Trends & Statistics, Growth Forecasts (2026 - 2031)
According to Mordor Intelligence, multi-touch attribution market size in 2026 is estimated at USD 2.76 billion, growing from 2025 value of USD 2.43 billion with 2031 projections showing USD 5.17 billion, growing at 13.41% CAGR over 2026-2031.
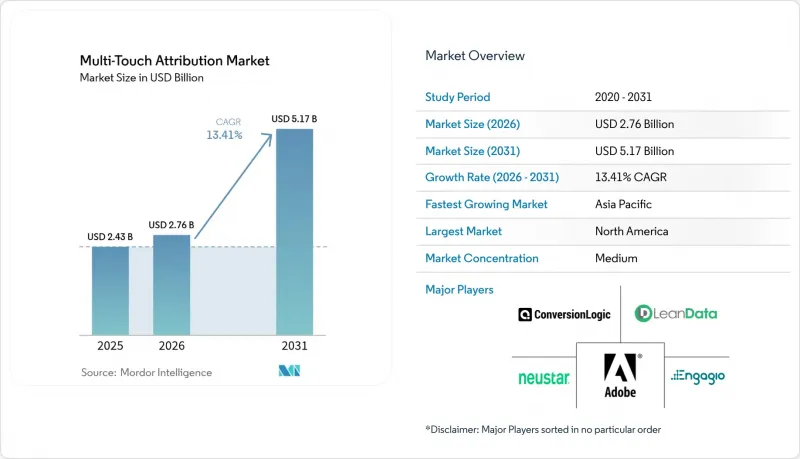
This report is Segmented by Attribution Model (Algorithmic/Data-Driven, Linear, Time-Decay, and More), Component (Solutions, and Services), Deployment Mode (Cloud, and On-Premise), Organization Size (Small and Medium Enterprises, and Large Enterprises), End-User Industry (Retail and E-Commerce, BFSI, IT and Telecom, and More), and Geography. The Market Forecasts are Provided in Terms of Value (USD).
Global Multi-Touch Attribution Market Trends and Insights
Increasing First-Party Data Strategies Spurred by Cookie-Less Browsers
Third-party cookie deprecation has pushed companies to build consent-based data foundations anchored in customer data platforms. Brands integrating identity resolution, differential privacy, and secure computation are reporting higher lifetime value and lower acquisition costs. As data flows shift from probabilistic to deterministic, demand rises for attribution engines able to ingest hashed emails, loyalty IDs, and clean-room outputs while honoring regional privacy laws. Vendors that embed native consent orchestration and robust governance are winning large contracts, particularly in regulated industries.
Proliferation of Omnichannel Retail in Asia Fueling Complex Journeys
Asia-Pacific retailers now blend in-app, live-stream, and in-store touchpoints inside super-apps and unified wallets, generating intricate conversion paths. Gen Z shoppers expect seamless experiences, forcing merchants to deploy attribution that maps social discovery, QR-code activations, and store purchases in one graph. Early adopters confirm double-digit improvements in marketing efficiency after shifting from last-click to algorithmic models able to weight upper-funnel engagements.
Signal Loss from Privacy Regulations Hindering Data Collection
Rules such as GDPR and CPRA restrict cookies, cross-site tracking, and user profiling. Marketers face thinner datasets, heavier reliance on modeled conversions, and tougher consent workflows. Many respond by investing in clean rooms and additive noise techniques, yet attribution precision still drops when opt-out rates climb. Compliance expenses divert budgets from innovation, and perpetual policy changes create planning uncertainty.
Other drivers and restraints analyzed in the detailed report include:
- Rise of Retail Media Networks Elevating Offline-to-Online Attribution Needs
- Programmatic CTV Advertising Adoption in North America
- Marketing-Ops Talent Shortage for Advanced Analytics Deployment
For complete list of drivers and restraints, kindly check the Table Of Contents.
Segment Analysis
Algorithmic and data-driven frameworks controlled 34.25% share in 2025 and will expand at 14.05% CAGR to 2031, marking the clear shift from rule-based to machine-learning approaches. These models parse billions of touchpoints to assign conversion credit dynamically, eliminating constant rule tweaking and boosting predictive accuracy. Linear, time-decay, and U-shape approaches persist for transitional mandates or single-channel campaigns but are ceding ground as marketers witness higher return on ad spend under probabilistic, AI-powered calculations. Meridian, Mix Modeler, and similar offerings embed causal inference that benchmarks true lift, while self-serve interfaces let non-technical teams launch tests without coding.
Continued investment in algorithmic engines will lift the multi-touch attribution market as brands demand faster insights and cross-device granularity. When advanced methodologies are paired with privacy-tech layers, enterprises balance compliance and performance, reinforcing adoption momentum. Early pilots reveal that brands replacing last-click with algorithmic models have trimmed wasted spend by double digits, steering budget to channels previously undervalued.
Solutions still provided 69.10% of 2025 revenue by delivering the core data ingestion, modeling, and visualization stack that defines the multi-touch attribution market. Yet services are accelerating at a 15.85% CAGR as enterprises realize the need for strategy consulting, data mapping, and model governance. Large brands tap integration partners to link point-of-sale data, CRM events, streaming logs, and consent strings, underscoring why services revenue rises faster than licenses.
Managed services further appeal to organizations confronting skill shortages. Outsourced analysts fine-tune algorithm weights, run incrementality studies, and interpret dashboards for C-suite decisions. This hands-on support not only raises renewal rates for platform vendors but also drives incremental market revenue as post-implementation optimization becomes a multi-year engagement.
Complete Report Scope:
- By Attribution Model
- Algorithmic/Data-Driven
- Linear
- Time-Decay
- U-Shape/Position-Based
- Others (Custom, First/Last Touch)
- By Component
- Solutions
- Services
- Consulting
- Integration and Deployment
- Support and Maintenance
- By Deployment Mode
- Cloud
- On-Premise
- By Organization Size
- Small and Medium Enterprises (SMEs)
- Large Enterprises
- By End-User Industry
- Retail and E-commerce
- BFSI
- IT and Telecom
- Consumer Electronics and Durables
- Travel and Tourism
- Healthcare and Life Sciences
- Media and Entertainment
- By Geography
- North America
- United States
- Canada
- Mexico
- Europe
- Germany
- United Kingdom
- France
- Nordics
- Rest of Europe
- South America
- Brazil
- Rest of South America
- Asia Pacific
- China
- Japan
- India
- South East Asia
- Rest of Asia Pacific
- Middle East and Africa
- Middle East
- Gulf Cooperation Council Countries
- Turkey
- Rest of Middle East
- Africa
- South Africa
- Rest of Africa
- Middle East
- North America
Geography Analysis
North America generated 39.20% of global revenue in 2025, driven by deep programmatic spend, connected-TV scale, and early traction for privacy-enhancing technologies. The United States is the epicenter for AI experimentation in marketing measurement, while Canada advances omnichannel retail analytics and Mexico emerges as a high-growth frontier for e-commerce attribution.
Europe ranks second, shaped by the General Data Protection Regulation, which positions privacy-by-design as a non-negotiable buying criterion. Germany favors B2B attribution for manufacturing export chains, the United Kingdom emphasizes finance and retail, and France is scaling retail-media measurement as supermarkets diversify revenue streams. Nordic countries stand out for mobile-first attribution sophistication, aided by broad 5G coverage and high app penetration.
Asia-Pacific is the fastest-growing region at 14.85% CAGR to 2031, reflecting mobile-centric consumer behavior, super-app ecosystems, and live-stream commerce. China pilots attribution that stitches live-stream interactions, social referrals, and in-store QR code scans, illustrating demand for models that parse intertwined touchpoints. Japan pushes cross-device attribution for connected-TV and gaming, while India's expanding digital payments infrastructure fuels attribution needs in retail and fintech. Southeast Asian markets, from Singapore to Indonesia, prioritize omnichannel analytics as brick-and-mortar chains launch digital storefronts. Collectively, these dynamics ensure the multi-touch attribution market captures expanding budgets across all major geographies.
- Adobe Inc.
- Alphabet Inc. (Google Analytics 360)
- AppsFlyer Ltd.
- Adjust GmbH
- Branch Metrics Inc.
- C3 Metrics Inc.
- CaliberMind Inc.
- Conversion Logic Inc.
- Engagio Inc. (Demandbase)
- HubSpot Inc.
- Improvado Inc.
- Impact.com Inc.
- LeanData Inc.
- LeadsRx Inc. (Acquire.io)
- Merkle Inc.
- Model N Inc.
- Neustar Inc.
- NielsenIQ (VisualIQ)
- Oracle Corp. (Eloqua)
- Rockerbox Inc.
- SAP SE
- SegmentStream Ltd.
- Singular Labs Inc.
- The Trade Desk Inc.
Additional Benefits:
- The market estimate (ME) sheet in Excel format
- 3 months of analyst support
TABLE OF CONTENTS
1 INTRODUCTION
- 1.1 Study Assumptions and Market Definition
- 1.2 Scope of the Study
2 RESEARCH METHODOLOGY
3 EXECUTIVE SUMMARY
4 MARKET LANDSCAPE
- 4.1 Market Overview
- 4.2 Market Drivers
- 4.2.1 Increasing First-Party Data Strategies Spurred by Cookie-less Browsers
- 4.2.2 Proliferation of Omnichannel Retail in Asia Fueling Complex Journeys
- 4.2.3 Rise of Retail Media Networks Elevating Offline-to-Online Attribution Needs
- 4.2.4 Programmatic CTV Advertising Adoption in North America
- 4.2.5 AI-Powered Marketing Automation Suites Bundling Attribution Natively
- 4.3 Market Restraints
- 4.3.1 Signal Loss from Privacy Regulations (GDPR, CPRA) Hindering Data Collection
- 4.3.2 Marketing-Ops Talent Shortage for Advanced Analytics Deployment
- 4.3.3 High Integration Costs with Legacy MarTech Stacks in Europe
- 4.3.4 Disparate ID Graph Standards Limiting Cross-Device Stitching Accuracy
- 4.4 Industry Ecosystem Analysis
- 4.5 Technological Outlook
- 4.6 Porter's Five Forces Analysis
- 4.6.1 Bargaining Power of Suppliers
- 4.6.2 Bargaining Power of Buyers
- 4.6.3 Threat of New Entrants
- 4.6.4 Threat of Substitutes
- 4.6.5 Competitive Rivalry
5 MARKET SIZE AND GROWTH FORECASTS (VALUES)
- 5.1 By Attribution Model
- 5.1.1 Algorithmic/Data-Driven
- 5.1.2 Linear
- 5.1.3 Time-Decay
- 5.1.4 U-Shape/Position-Based
- 5.1.5 Others (Custom, First/Last Touch)
- 5.2 By Component
- 5.2.1 Solutions
- 5.2.2 Services
- 5.2.2.1 Consulting
- 5.2.2.2 Integration and Deployment
- 5.2.2.3 Support and Maintenance
- 5.3 By Deployment Mode
- 5.3.1 Cloud
- 5.3.2 On-Premise
- 5.4 By Organization Size
- 5.4.1 Small and Medium Enterprises (SMEs)
- 5.4.2 Large Enterprises
- 5.5 By End-User Industry
- 5.5.1 Retail and E-commerce
- 5.5.2 BFSI
- 5.5.3 IT and Telecom
- 5.5.4 Consumer Electronics and Durables
- 5.5.5 Travel and Tourism
- 5.5.6 Healthcare and Life Sciences
- 5.5.7 Media and Entertainment
- 5.6 By Geography
- 5.6.1 North America
- 5.6.1.1 United States
- 5.6.1.2 Canada
- 5.6.1.3 Mexico
- 5.6.2 Europe
- 5.6.2.1 Germany
- 5.6.2.2 United Kingdom
- 5.6.2.3 France
- 5.6.2.4 Nordics
- 5.6.2.5 Rest of Europe
- 5.6.3 South America
- 5.6.3.1 Brazil
- 5.6.3.2 Rest of South America
- 5.6.4 Asia Pacific
- 5.6.4.1 China
- 5.6.4.2 Japan
- 5.6.4.3 India
- 5.6.4.4 South East Asia
- 5.6.4.5 Rest of Asia Pacific
- 5.6.5 Middle East and Africa
- 5.6.5.1 Middle East
- 5.6.5.1.1 Gulf Cooperation Council Countries
- 5.6.5.1.2 Turkey
- 5.6.5.1.3 Rest of Middle East
- 5.6.5.2 Africa
- 5.6.5.2.1 South Africa
- 5.6.5.2.2 Rest of Africa
- 5.6.5.1 Middle East
- 5.6.1 North America
6 COMPETITIVE LANDSCAPE
- 6.1 Market Concentration
- 6.2 Strategic Moves
- 6.3 Market Share Analysis
- 6.4 Company Profiles (includes Global level Overview, Market level overview, Core Segments, Financials as available, Strategic Information, Market Rank/Share for key companies, Products and Services, and Recent Developments)
- 6.4.1 Adobe Inc.
- 6.4.2 Alphabet Inc. (Google Analytics 360)
- 6.4.3 AppsFlyer Ltd.
- 6.4.4 Adjust GmbH
- 6.4.5 Branch Metrics Inc.
- 6.4.6 C3 Metrics Inc.
- 6.4.7 CaliberMind Inc.
- 6.4.8 Conversion Logic Inc.
- 6.4.9 Engagio Inc. (Demandbase)
- 6.4.10 HubSpot Inc.
- 6.4.11 Improvado Inc.
- 6.4.12 Impact.com Inc.
- 6.4.13 LeanData Inc.
- 6.4.14 LeadsRx Inc. (Acquire.io)
- 6.4.15 Merkle Inc.
- 6.4.16 Model N Inc.
- 6.4.17 Neustar Inc.
- 6.4.18 NielsenIQ (VisualIQ)
- 6.4.19 Oracle Corp. (Eloqua)
- 6.4.20 Rockerbox Inc.
- 6.4.21 SAP SE
- 6.4.22 SegmentStream Ltd.
- 6.4.23 Singular Labs Inc.
- 6.4.24 The Trade Desk Inc.
7 MARKET OPPORTUNITIES AND FUTURE OUTLOOK
- 7.1 White-Space and Unmet-Need Assessment

