PUBLISHER: Mordor Intelligence | PRODUCT CODE: 2124402

PUBLISHER: Mordor Intelligence | PRODUCT CODE: 2124402
Cognitive Operations - Market Share Analysis, Industry Trends & Statistics, Growth Forecasts (2026 - 2031)
According to Mordor Intelligence, the cognitive operations market size was valued at USD 20.47 billion in 2025 and estimated to grow from USD 23.78 billion in 2026 to reach USD 50.39 billion by 2031, at a CAGR of 16.18% during the forecast period (2026-2031).
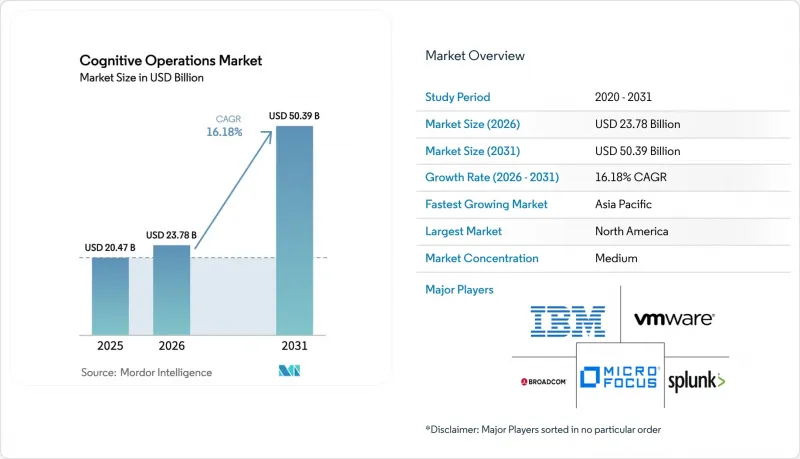
This report is Segmented by Component (Solutions and Services), Deployment Mode (Cloud and On-Premises), Enterprise Size (Large Enterprises and Small and Medium-Sized Enterprises), Application (IT Operations Analytics, Application Performance Management, Network Analytics, and More), Industry Vertical (BFSI, Healthcare And& Life Sciences, IT and Telecom, Retail and E-Commerce, and More), and Geography.
Global Cognitive Operations Market Trends and Insights
Growing Focus on Cloud-Based Cognitive IT Operations
Cloud-native cognitive operations platforms deliver on-demand scalability that traditional on-premises tools cannot match. Enterprises leverage built-in AI services from global cloud providers to ingest, store, and analyse petabytes of telemetry while maintaining sub-second alerting. The model lowers infrastructure overhead and cuts mean time to recovery by up to 40%, freeing engineering teams for higher-value tasks. Cloud adoption also accelerates feature velocity, allowing vendors to push daily enhancements that sharpen anomaly detection accuracy. As a result, organisations re-evaluate build-versus-buy strategies and overwhelmingly favour subscription models anchored in usage-based pricing.
Rising Demand for Monitoring Complex IT Environments
Microservices, containers, serverless functions, and edge nodes now form the backbone of digital business. A single customer transaction may traverse dozens of loosely coupled services spanning multiple clouds, making fault isolation arduous. Cognitive operations platforms apply unsupervised learning to correlate subtle signals across this sprawl, preventing cascading failures that could degrade user experience in milliseconds. Reported reductions of up to 80% in unplanned downtime translate directly into higher Net Promoter Scores and revenue retention for digital-first enterprises.
Integration Challenges with Legacy Systems
Mainframe and proprietary applications dating back decades often lack modern observability hooks, forcing bespoke connectors that inflate project cost and risk. Financial institutions contend with COBOL-based core banking engines that must exchange data securely with AI-driven analytics without disrupting transaction throughput. Such integration work can consume up to half of total deployment budgets and elongate payback periods. The scarcity of professionals who understand both legacy architectures and AIOps exacerbates delays.
Other drivers and restraints analyzed in the detailed report include:
- Surge in IT-Ops Data Volume from Digital Transformation
- AI-Driven Proactive Incident Management Adoption
- Dearth of Skills and Expertise
For complete list of drivers and restraints, kindly check the Table Of Contents.
Segment Analysis
Solutions retained a 64.30% share of the cognitive operations market in 2025, cementing their role as the architectural backbone for telemetry collection, correlation, and automation. Yet Services revenue is projected to climb at 17.05% CAGR to 2031 as enterprises recognise that algorithm tuning, continuous model retraining, and organisational change management dictate ultimate ROI. The cognitive operations market size for professional services is forecast to reach USD 18.8 billion by 2031, reflecting a shift from license sales to outcome-based engagements.
Ongoing optimisation contracts and managed service offerings flourish because platforms require constant calibration to accommodate new microservices, evolving threat landscapes, and compliance mandates. Service providers deliver 24/7 monitoring, reducing incident fatigue for in-house teams and accelerating mean time to detection. As the scarcity of specialised talent persists, advisory and managed offerings become the fastest route to operational maturity for resource-constrained enterprises.
Cloud accounts for 71.20% of the cognitive operations market size and will continue expanding at a 17.55% CAGR, mirroring enterprise migration from monolithic data centres to elastic multi-cloud footprints. Vendors deliver platform updates weekly, embedding new analytics models without customer intervention, which shortens innovation cycles and lifts detection accuracy.
On-premises deployments persist in defence and financial services where data sovereignty is paramount, but even these sectors adopt hybrid models that offload heavy-duty analytics to the cloud while keeping raw data local. Edge-native AIOps emerges as a complementary approach for 5G and industrial IoT use cases requiring sub-millisecond inference. The interplay of cloud, on-premises, and edge options expands vendor differentiation beyond features to encompass data-gravity, latency, and regulatory considerations.
Complete Report Scope:
- By Component
- Solutions
- Services
- By Deployment Mode
- Cloud
- On-Premises
- By Enterprise Size
- Large Enterprises
- Small and Medium-Sized Enterprises
- By Application
- IT Operations Analytics
- Application Performance Management
- Network Analytics
- Security Analytics
- Infrastructure Management
- Other Applications
- By Industry Vertical
- BFSI
- Healthcare and Life Sciences
- IT and Telecom
- Retail and E-commerce
- Other Industry Verticals
- By Geography
- North America
- United States
- Canada
- Mexico
- South America
- Brazil
- Argentina
- Rest of South America
- Europe
- Germany
- United Kingdom
- France
- Italy
- Spain
- Rest of Europe
- Asia-Pacific
- China
- Japan
- India
- South Korea
- Rest of Asia-Pacific
- Middle East and Africa
- Middle East
- United Arab Emirates
- Saudi Arabia
- Turkey
- Rest of Middle East
- Africa
- South Africa
- Nigeria
- Egypt
- Rest of Africa
- Middle East
- North America
Geography Analysis
North America commands 37.40% of 2025 revenue, buoyed by the tight integration of observability with cloud-service portfolios from AWS, Microsoft Azure, and Google Cloud. Venture-capital inflows into AIOps start-ups surpassed USD 4.6 billion between 2024 and 2025, accelerating product maturity and ecosystem depth. Major acquisitions, exemplified by Cisco's purchase of Splunk, broaden platform capability from log analytics to full-stack security and network telemetry. US financial institutions and hyperscalers act as anchor tenants, pushing vendors toward FedRAMP and SOC 2 certifications that, once achieved, unlock adjacent public-sector opportunities.
Asia Pacific is the fastest-growing region, expanding at an 17.61% CAGR. Telecommunications operators in Japan and South Korea rely on edge-native analytics to orchestrate 5G network slices, while Chinese cloud providers embed AIOps directly into Infrastructure-as-a-Service layers for manufacturing and ecommerce customers. India's managed-service giants deploy cognitive operations to meet stringent service-level objectives for global clients, turning the subcontinent into a talent hub for AIOps engineering. Regional governments, meanwhile, invest in national AI strategies that subsidize research and lower barriers to enterprise adoption.
Europe exhibits steady but compliance-conscious growth. The EU's AI Act and GDPR necessitate privacy-by-design data pipelines, compelling vendors to implement granular telemetry filtering and sovereign-cloud deployment options. German automotive OEMs tie cognitive operations to smart-factory rollouts, optimizing robotics uptime and energy consumption. The United Kingdom emphasizes operational resilience in financial services, requiring annual impact tolerance tests that stimulate spending on automated failover and chaos-engineering tools. Sustainability mandates further spur GreenOps modules that quantify carbon emissions and suggest workload re-balancing across greener data centers.
- IBM Corporation
- Splunk Inc.
- Broadcom Inc.
- Dynatrace LLC
- BMC Software Inc.
- HCL Technologies Ltd.
- VMware Inc.
- Micro Focus International Plc
- ServiceNow Inc.
- New Relic Inc.
- ScienceLogic Inc.
- CloudFabrix Software Inc.
- Devo Technology Inc.
- Interlink Software Services Ltd.
- Correlata Solutions Inc.
- Loom Systems Inc.
- Moogsoft Inc.
- Elastic NV
- Datadog Inc.
- OpsRamp Inc.
- PagerDuty Inc.
- Sumo Logic Inc.
- AppDynamics LLC (Cisco)
Additional Benefits:
- The market estimate (ME) sheet in Excel format
- 3 months of analyst support
TABLE OF CONTENTS
1 INTRODUCTION
- 1.1 Study Assumptions and Market Definition
- 1.2 Scope of the Study
2 RESEARCH METHODOLOGY
3 EXECUTIVE SUMMARY
4 MARKET LANDSCAPE
- 4.1 Market Overview
- 4.2 Market Drivers
- 4.2.1 Growing focus on cloud-based cognitive IT operations
- 4.2.2 Rising demand for monitoring complex IT environments
- 4.2.3 Surge in IT-ops data volume from digital transformation
- 4.2.4 AI-driven proactive incident management adoption
- 4.2.5 Edge-native AIOps for 5G network slices (under-the-radar)
- 4.2.6 GreenOps push for energy-optimised AI-ops (under-the-radar)
- 4.3 Market Restraints
- 4.3.1 Integration challenges with legacy systems
- 4.3.2 Dearth of skills and expertise
- 4.3.3 Proprietary algorithms create governance risk (under-the-radar)
- 4.3.4 Privacy regulations limit telemetry capture (under-the-radar)
- 4.4 Value/Supply-Chain Analysis
- 4.5 Regulatory Landscape
- 4.6 Technological Outlook
- 4.7 Porter's Five Forces Analysis
- 4.7.1 Bargaining Power of Suppliers
- 4.7.2 Bargaining Power of Buyers
- 4.7.3 Threat of New Entrants
- 4.7.4 Threat of Substitutes
- 4.7.5 Intensity of Competitive Rivalry
- 4.8 Pricing Analysis
- 4.9 Assessment of COVID-19 Impact
- 4.10 Investment Analysis
5 MARKET SIZE AND GROWTH FORECASTS (VALUE)
- 5.1 By Component
- 5.1.1 Solutions
- 5.1.2 Services
- 5.2 By Deployment Mode
- 5.2.1 Cloud
- 5.2.2 On-Premises
- 5.3 By Enterprise Size
- 5.3.1 Large Enterprises
- 5.3.2 Small and Medium-Sized Enterprises
- 5.4 By Application
- 5.4.1 IT Operations Analytics
- 5.4.2 Application Performance Management
- 5.4.3 Network Analytics
- 5.4.4 Security Analytics
- 5.4.5 Infrastructure Management
- 5.4.6 Other Applications
- 5.5 By Industry Vertical
- 5.5.1 BFSI
- 5.5.2 Healthcare and Life Sciences
- 5.5.3 IT and Telecom
- 5.5.4 Retail and E-commerce
- 5.5.5 Other Industry Verticals
- 5.6 By Geography
- 5.6.1 North America
- 5.6.1.1 United States
- 5.6.1.2 Canada
- 5.6.1.3 Mexico
- 5.6.2 South America
- 5.6.2.1 Brazil
- 5.6.2.2 Argentina
- 5.6.2.3 Rest of South America
- 5.6.3 Europe
- 5.6.3.1 Germany
- 5.6.3.2 United Kingdom
- 5.6.3.3 France
- 5.6.3.4 Italy
- 5.6.3.5 Spain
- 5.6.3.6 Rest of Europe
- 5.6.4 Asia-Pacific
- 5.6.4.1 China
- 5.6.4.2 Japan
- 5.6.4.3 India
- 5.6.4.4 South Korea
- 5.6.4.5 Rest of Asia-Pacific
- 5.6.5 Middle East and Africa
- 5.6.5.1 Middle East
- 5.6.5.1.1 United Arab Emirates
- 5.6.5.1.2 Saudi Arabia
- 5.6.5.1.3 Turkey
- 5.6.5.1.4 Rest of Middle East
- 5.6.5.2 Africa
- 5.6.5.2.1 South Africa
- 5.6.5.2.2 Nigeria
- 5.6.5.2.3 Egypt
- 5.6.5.2.4 Rest of Africa
- 5.6.5.1 Middle East
- 5.6.1 North America
6 COMPETITIVE LANDSCAPE
- 6.1 Market Concentration
- 6.2 Strategic Moves
- 6.3 Market Share Analysis
- 6.4 Company Profiles (includes Global level Overview, Market level overview, Core Segments, Financials as available, Strategic Information, Market Rank/Share for key companies, Products and Services, and Recent Developments)
- 6.4.1 IBM Corporation
- 6.4.2 Splunk Inc.
- 6.4.3 Broadcom Inc.
- 6.4.4 Dynatrace LLC
- 6.4.5 BMC Software Inc.
- 6.4.6 HCL Technologies Ltd.
- 6.4.7 VMware Inc.
- 6.4.8 Micro Focus International Plc
- 6.4.9 ServiceNow Inc.
- 6.4.10 New Relic Inc.
- 6.4.11 ScienceLogic Inc.
- 6.4.12 CloudFabrix Software Inc.
- 6.4.13 Devo Technology Inc.
- 6.4.14 Interlink Software Services Ltd.
- 6.4.15 Correlata Solutions Inc.
- 6.4.16 Loom Systems Inc.
- 6.4.17 Moogsoft Inc.
- 6.4.18 Elastic NV
- 6.4.19 Datadog Inc.
- 6.4.20 OpsRamp Inc.
- 6.4.21 PagerDuty Inc.
- 6.4.22 Sumo Logic Inc.
- 6.4.23 AppDynamics LLC (Cisco)
7 MARKET OPPORTUNITIES AND FUTURE OUTLOOK
- 7.1 White-space and Unmet-Need Assessment

