PUBLISHER: Mordor Intelligence | PRODUCT CODE: 2124459

PUBLISHER: Mordor Intelligence | PRODUCT CODE: 2124459
Optical Wavelength Services - Market Share Analysis, Industry Trends & Statistics, Growth Forecasts (2026 - 2031)
According to Mordor Intelligence, the optical wavelength services market size stands at USD 6.07 billion in 2026 and is projected to reach USD 10.89 billion by 2031, registering a 12.40% CAGR over the period.
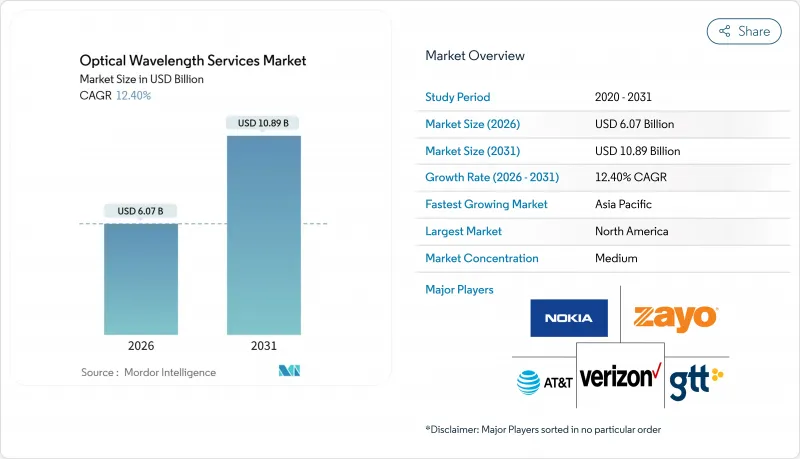
This report is Segmented by Wavelength Capacity (10G, 40G, 100G, and More), Service Type (Managed Lit Wavelength, Dark Fiber/Spectrum, and More), End-User Industry (IT and Telecom Carriers, Cloud and Hyperscale Providers, BFSI, Healthcare and Life Sciences, and More), Application (Metro/Access, Regional/Long-haul, and More), and Geography. The Market Forecasts are Provided in Terms of Value (USD).
Global Optical Wavelength Services Market Trends and Insights
Increasing Data Traffic and Bandwidth Demand
Global IP traffic jumped from 4.8 zettabytes in 2025 to a forecast 8.2 zettabytes by 2030, pushing operators to migrate from 100 G to 400 G and 800 G coherent optics that multiply spectral efficiency. Video streaming, cloud gaming, and generative-AI inference already constitute 82% of consumer traffic, while enterprise replication workloads maintain 35% annual inter-DC bandwidth growth. Operators that guarantee sub-5 ms latency and 99.99% uptime, notably Lumen Technologies and Telia Carrier, are winning financial-services contracts across New York, London, and Tokyo. Deployments of Ciena WaveLogic 6 Extreme enable 1.6 Tb/s per wavelength, slashing cost per bit by 40% and reinforcing the optical wavelength services market's value proposition. Looming 8K video, VR conferencing, and autonomous-vehicle telemetry will drive further uptake through 2031.
Surge in Hyperscale and Cloud DC Footprints
Hyperscalers commissioned 128 new data-center sites in 2025, raising the global count to 1,042 and jointly controlling 68% installed capacity. Each facility demands dedicated 400 G-800 G links for availability-zone replication and AI training clusters, compelling AWS to invest USD 15 billion, Microsoft Azure USD 12 billion, and Google Cloud in extensive subsea assets. Their vertical integration squeezes carrier margins and accelerates adoption of API-driven, on-demand wavelength platforms that the optical wavelength services market continues to monetize via value-added analytics and hybrid colocation bundles.
High CAPEX for Long-Haul Builds
A 1,000 km terrestrial route demands USD 80,000-120,000 per km in developed markets and USD 50,000-90,000 in emerging economies, while a transoceanic cable exceeds USD 300 million. Financing is becoming more challenging as the weighted average capital cost rose from 6.2% in 2023 to 8.7% in 2025, steering operators toward metro builds and slowing underserved corridor expansion. The USD 1 billion 2Africa cable, for instance, will not be cash-positive until 2029, highlighting the financing pressures in the optical wavelength services market. Vertical integration by hyperscalers further reduces addressable wholesale demand, and regulatory ambiguities in India, Brazil, and Nigeria extend permitting by up to 24 months.
Other drivers and restraints analyzed in the detailed report include:
- 5G Backhaul and Fronthaul Densification
- AI-Driven Traffic Pattern Optimization
- Rapid Wavelength-Rate Obsolescence
For complete list of drivers and restraints, kindly check the Table Of Contents.
Segment Analysis
The 100 G tier held 46.63% of optical wavelength services market share in 2025, reflecting its entrenched installed base. The 800 G and above cohort, however, is rising 13.34% annually, fueled by submarine upgrades and AI-centric DCI fabrics. The optical wavelength services market size, attributable to 400 G ports, captured 18% of shipments in 2025 and is now the de facto backbone for 5G transport. Meanwhile, 10 G and 40 G links continue a 4-6% annual decline as SONET and SDH systems are retired. The shift toward 1.6 T optics by 2028, already demonstrated on Southern Cross NEXT, suggests further suppression of legacy platform economics. Smaller operators weigh leasing wholesale 400 G-800 G wavelengths against upfront investment, tailoring decisions to traffic density and access to capital.
Upgrades are also aided by regulatory support, for instance, the FCC's 2025 pole-attachment reforms reduced deployment costs and expedited fiber strand additions, indirectly accelerating the adoption of next-gen optics. Hyperscalers' insatiable demand for AI training bandwidth has shifted the threshold of economic viability: capacity-hungry clusters can now justify premium coherent pluggables, solidifying 800 G as the new standard within the optical wavelength services market.
Managed lit wavelengths delivered 54.73% of revenue in 2025 but are losing share to dark fiber and spectrum leasing, which grow 13.76% annually as cloud giants favor control over optical line systems. The optical wavelength services market size tied to Ethernet-over-wave and optical VPN offerings remains stable, catering to enterprises needing Layer-2 flexibility and hardware-level encryption.
Open-line-system advocacy from the Telecom Infra Project reduces vendor lock-in, allowing carriers to mix equipment and shave CAPEX 20-30%. Zayo's spectrum-as-a-service and Lumen's bundled edge colocation exemplify how incumbents innovate to retain clientele. For customers with fewer than ten sites, operational complexity keeps managed services compelling, but hyperscalers and large banks increasingly view dark fiber as strategic, accelerating vertical integration within the optical wavelength services market.
Complete Report Scope:
- By Wavelength Capacity
- 10 G
- 40 G
- 100 G
- 200 G
- 400 G and above
- By Service Type
- Managed (Lit) Wavelength
- Dark Fiber / Spectrum
- Ethernet-over-Wave
- Optical VPN
- By End-user Industry
- IT and Telecom Carriers
- Cloud and Hyperscale Providers
- BFSI
- Healthcare and Life Sciences
- Government and Public Sector
- Media and Entertainment
- By Application
- Metro/Access
- Regional/Long-haul
- Sub-sea
- Edge/Inter-DC
- By Geography
- North America
- United States
- Canada
- Mexico
- South America
- Brazil
- Argentina
- Rest of South America
- Europe
- Germany
- United Kingdom
- France
- Italy
- Spain
- Rest of Europe
- Asia-Pacific
- China
- Japan
- India
- South Korea
- ASEAN
- Rest of Asia-Pacific
- Middle East and Africa
- Middle East
- Saudi Arabia
- United Arab Emirates
- Rest of Middle East
- Africa
- South Africa
- Nigeria
- Rest of Africa
- Middle East
- North America
Geography Analysis
North America's 38.73% revenue share in 2025 rests on dense hyperscale footprints and 5G deployment. Verizon's 15,000 C-band cell sites consumed around 22% of metro capacity, while AWS, Azure, and Google Cloud jointly leased more than 80,000 fiber-pair-kilometers across U.S. regions. Charter and Comcast expanded enterprise fiber routes by double digits, and Mexico's near-shoring boom drove 9% optical growth in 2025. FCC pole-attachment reforms further bolster rural rollouts, keeping the optical wavelength services market resilient.
Asia Pacific, forecast at a 13.56% CAGR through 2031, benefits from China Telecom's CNY 180 billion (USD 25 billion) 400 G-800 G upgrade plan and India's INR 120 billion (USD 1.44 billion) BharatNet Phase III builds. Japan's JPY 220 billion (USD 1.63 billion) urban deployments and twin SEA-H2X/Asia Link cables double regional subsea capacity, while South Korea's AI-anchored data-centers escalate intra-DCI demand. Collectively, these initiatives reinforce Asia Pacific as the fastest-growing optical wavelength services market globally.
Europe's 24% share in 2025 hinges on BT, Orange, and Telia Carrier's metro extensions to serve 5G and cloud interconnects. The Gigabit Infrastructure Act, effective June 2025, simplifies rights-of-way and mandates infrastructure sharing, slashing project costs 18%. Colt and euNetworks injected EUR 480 million (USD 542.4 million) into Frankfurt-Amsterdam-London-Paris routes, securing sub-5 ms latency for financial clients. Together, policy harmonization and private investments promise steady expansion for the region's optical wavelength services market.
Middle East and Africa represents 7% revenue but registers outsized momentum after 2Africa's April 2025 launch. Saudi Arabia's USD 6.4 billion national 400 G project, UAE's AED 2.8 billion (USD 756 million) 5G backhaul investment, and Liquid Intelligent Technologies' 22,000 km network extension collectively raise capacity and catalyze terrestrial build-outs. South America's 6% share stems from Brazil's 8,400 km metro expansions and Argentina's USD 420 million Buenos Aires upgrade, illustrating spreading demand across the Southern Hemisphere.
- Nokia Corporation
- Zayo Group Holdings, Inc.
- Verizon Communications Inc.
- GTT Communications, Inc.
- AT&T Inc.
- Lumen Technologies Inc.
- T-Mobile US, Inc.
- Crown Castle Inc.
- Comcast Corporation
- Charter Communications, Inc.
- Windstream Holdings, Inc.
- Colt Technology Services Group Ltd.
- Cox Communications, Inc.
- Jaguar Network SAS (Iliad)
- CarrierBid Communications
- euNetworks Group Ltd.
- Telia Carrier AB
- Exa Infrastructure Ltd.
- Ciena Corporation
- Orange S.A.
- BT Group plc
- Tata Communications Ltd.
- China Telecom Global Ltd.
- Liquid Intelligent Technologies
Additional Benefits:
- The market estimate (ME) sheet in Excel format
- 3 months of analyst support
TABLE OF CONTENTS
1 INTRODUCTION
- 1.1 Study Assumptions and Market Definition
- 1.2 Scope of the Study
2 RESEARCH METHODOLOGY
3 EXECUTIVE SUMMARY
4 MARKET LANDSCAPE
- 4.1 Market Overview
- 4.2 Market Drivers
- 4.2.1 Increasing Data Traffic and Bandwidth Demand
- 4.2.2 Surge in Hyperscale and Cloud DC Footprints
- 4.2.3 5G Backhaul and Fronthaul Densification
- 4.2.4 AI-Driven Traffic Pattern Optimisation
- 4.2.5 Growth of Low-Latency Edge Interconnect Sites
- 4.2.6 Sub-Sea Upgrade Cycles to 800G-1.6T Channels
- 4.3 Market Restraints
- 4.3.1 High CAPEX for Long-Haul Builds
- 4.3.2 Rapid Wavelength-Rate Obsolescence
- 4.3.3 Scarcity of Metro-Core Conduit in Tier-1 Cities
- 4.3.4 Lengthy Rights-of-Way Permitting in Emerging Markets
- 4.4 Industry Value Chain Analysis
- 4.5 Regulatory Landscape
- 4.6 Technological Outlook
- 4.7 Porter's Five Forces Analysis
- 4.7.1 Threat of New Entrants
- 4.7.2 Bargaining Power of Suppliers
- 4.7.3 Bargaining Power of Buyers
- 4.7.4 Threat of Substitutes
- 4.7.5 Competitive Rivalry
5 MARKET SIZE AND GROWTH FORECASTS (VALUE)
- 5.1 By Wavelength Capacity
- 5.1.1 10 G
- 5.1.2 40 G
- 5.1.3 100 G
- 5.1.4 200 G
- 5.1.5 400 G and above
- 5.2 By Service Type
- 5.2.1 Managed (Lit) Wavelength
- 5.2.2 Dark Fiber / Spectrum
- 5.2.3 Ethernet-over-Wave
- 5.2.4 Optical VPN
- 5.3 By End-user Industry
- 5.3.1 IT and Telecom Carriers
- 5.3.2 Cloud and Hyperscale Providers
- 5.3.3 BFSI
- 5.3.4 Healthcare and Life Sciences
- 5.3.5 Government and Public Sector
- 5.3.6 Media and Entertainment
- 5.4 By Application
- 5.4.1 Metro/Access
- 5.4.2 Regional/Long-haul
- 5.4.3 Sub-sea
- 5.4.4 Edge/Inter-DC
- 5.5 By Geography
- 5.5.1 North America
- 5.5.1.1 United States
- 5.5.1.2 Canada
- 5.5.1.3 Mexico
- 5.5.2 South America
- 5.5.2.1 Brazil
- 5.5.2.2 Argentina
- 5.5.2.3 Rest of South America
- 5.5.3 Europe
- 5.5.3.1 Germany
- 5.5.3.2 United Kingdom
- 5.5.3.3 France
- 5.5.3.4 Italy
- 5.5.3.5 Spain
- 5.5.3.6 Rest of Europe
- 5.5.4 Asia-Pacific
- 5.5.4.1 China
- 5.5.4.2 Japan
- 5.5.4.3 India
- 5.5.4.4 South Korea
- 5.5.4.5 ASEAN
- 5.5.4.6 Rest of Asia-Pacific
- 5.5.5 Middle East and Africa
- 5.5.5.1 Middle East
- 5.5.5.1.1 Saudi Arabia
- 5.5.5.1.2 United Arab Emirates
- 5.5.5.1.3 Rest of Middle East
- 5.5.5.2 Africa
- 5.5.5.2.1 South Africa
- 5.5.5.2.2 Nigeria
- 5.5.5.2.3 Rest of Africa
- 5.5.5.1 Middle East
- 5.5.1 North America
6 COMPETITIVE LANDSCAPE
- 6.1 Market Concentration
- 6.2 Strategic Moves
- 6.3 Market Share Analysis
- 6.4 Company Profiles (includes Global level Overview, Market level overview, Core Segments, Financials as available, Strategic Information, Market Rank/Share for key companies, Products and Services, and Recent Developments)
- 6.4.1 Nokia Corporation
- 6.4.2 Zayo Group Holdings, Inc.
- 6.4.3 Verizon Communications Inc.
- 6.4.4 GTT Communications, Inc.
- 6.4.5 AT&T Inc.
- 6.4.6 Lumen Technologies Inc.
- 6.4.7 T-Mobile US, Inc.
- 6.4.8 Crown Castle Inc.
- 6.4.9 Comcast Corporation
- 6.4.10 Charter Communications, Inc.
- 6.4.11 Windstream Holdings, Inc.
- 6.4.12 Colt Technology Services Group Ltd.
- 6.4.13 Cox Communications, Inc.
- 6.4.14 Jaguar Network SAS (Iliad)
- 6.4.15 CarrierBid Communications
- 6.4.16 euNetworks Group Ltd.
- 6.4.17 Telia Carrier AB
- 6.4.18 Exa Infrastructure Ltd.
- 6.4.19 Ciena Corporation
- 6.4.20 Orange S.A.
- 6.4.21 BT Group plc
- 6.4.22 Tata Communications Ltd.
- 6.4.23 China Telecom Global Ltd.
- 6.4.24 Liquid Intelligent Technologies
7 MARKET OPPORTUNITIES AND FUTURE OUTLOOK
- 7.1 White-space and Unmet-need Assessment

