PUBLISHER: Mordor Intelligence | PRODUCT CODE: 2124506

PUBLISHER: Mordor Intelligence | PRODUCT CODE: 2124506
Mobile Learning - Market Share Analysis, Industry Trends & Statistics, Growth Forecasts (2026 - 2031)
According to Mordor Intelligence, the mobile learning market size is estimated at USD 95.77 billion in 2026, and is expected to reach USD 200.24 billion by 2031, at a CAGR of 15.89% during the forecast period (2026-2031).
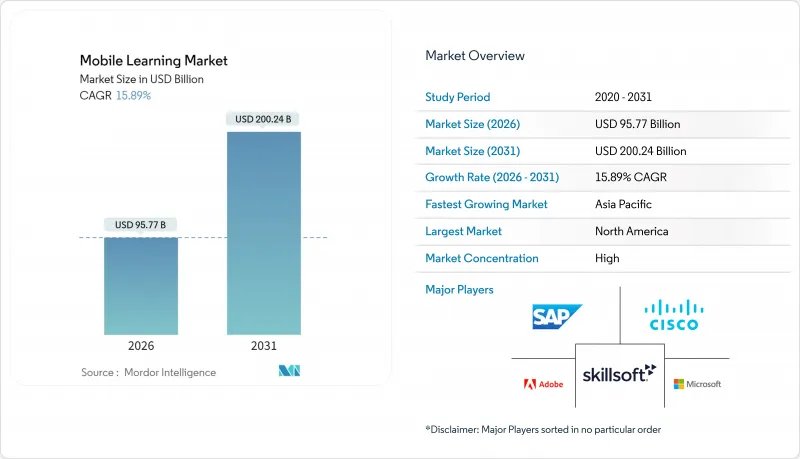
This report is Segmented by Solution (E-Books, Interactive Assessment, Mobile and Video-Based Courseware, and More), by Application (In-Class Learning, Corporate Learning, Simulation-Based Learning, and More), End-User (Academic Institutes, and Corporate Enterprises), Provider Type (Content Providers, and Service Providers), and Geography. The Market Forecasts are Provided in Terms of Value (USD).
Global Mobile Learning Market Trends and Insights
Rapid Adoption of Digital Learning Solutions in Corporate L&D
Corporate budgets pivoted toward mobile-first channels after hybrid work took hold in 2024. Fortune 500 firms now direct most training spend to smartphone-ready modules, a stance validated when LinkedIn Learning registered 78% corporate usage in 2024. Mobile-first programs consistently post higher completion and proficiency metrics than desktop-only equivalents, delivering measurable productivity dividends. Just-in-time learning embedded inside workflow tools drives quota attainment, and the marginal cost of adding each learner approaches zero once the platform is live, letting scale redefine competitive advantage.
Bring-Your-Own-Device Policies Across Enterprises
BYOD acceptance accelerated in 2024 when NIST issued step-by-step security guidelines, reducing chief information officer hesitation. Workers prefer using personal phones on commutes, and enterprises reap 40%-60% hardware savings. Yet, risk shifts to cybersecurity; endpoint vulnerability counts climb, forcing investments in mobile threat defense licenses that average USD 15-25 per user annually. Even with added security spend, the economics remain favorable, supporting wider adoption.
High Upfront Investment in Mobile-Ready Infrastructure
Mid-sized enterprises spend USD 1.2-2.8 million integrating mobile learning management systems with existing HR and authentication stacks. Nearly half of that total funds legacy-system connectors rather than the learning platform itself. Although cloud-native vendors offer pre-built APIs, customization still averages six to nine months, slowing time-to-value. Smaller companies often postpone adoption or rely on consumer-grade tools, deepening skill gaps versus larger peers.
Other drivers and restraints analyzed in the detailed report include:
- Rising Global Penetration of Smartphones, Tablets and Laptops
- Global 5G Roll-Out Enabling High-Definition Video and AR Mobile Courses
- Data-Security and Privacy Compliance Risks on Personal Devices
For complete list of drivers and restraints, kindly check the Table Of Contents.
Segment Analysis
M-enablement is growing at 16.82% CAGR through 2031 as enterprises fast-track desktop-course conversions rather than commission expensive net-new productions. The mobile learning market size attributed to e-books represented 30.46% of overall revenue in 2025, confirming the format's cost-effectiveness for foundational content. Retrofits slash delivery cycles from 12 months to 3 months, a decisive edge when tech skills now expire in half a decade. E-books, however, remain vital in low-bandwidth settings because learners can download once and study offline, keeping the mobile learning market accessible in data-cost-sensitive geographies.
Interactive assessments, gamified quizzes, and AI-driven adaptive testing supplement core formats. IBM's Watson-powered formative tools cut grading workloads by 60%, freeing faculty to coach rather than mark. Vendors that support open data standards like xAPI hold an advantage because buyers can mix and match e-books, interactive video, and simulations without vendor lock-in. Platforms forcing proprietary containers risk churn as enterprises favor openness to future-proof their digital libraries.
In-class learning still held 36.67% revenue share in 2025 due to entrenched K-12 and degree programs, yet simulation-based learning is tracking a 17.33% CAGR because it mitigates high-stakes mistakes in healthcare, aviation, and energy. The mobile learning market share of simulations is expected to rise as AR and VR modules become mainstream on 5G networks. Corporate L&D teams value the measurable drop in errors and downtime, and ed-tech vendors now bundle simulation libraries with analytics dashboards, proving ROI in months rather than years.
Mobile homework extensions blur the classroom boundary, turning evenings into continuous learning windows. Retail and hospitality chains deploy bite-sized scenario training that new hires consume within 48 hours, halving ramp-up time. Gig-workers and freelancers meanwhile drive independent learning, often self-funding portable credentials that cross employers, a trend reinforcing mobile platforms over desktop portals.
Complete Report Scope:
- By Solution
- E-Books
- Interactive Assessment
- Mobile and Video-Based Courseware
- M-Enablement
- Other Solutions
- By Application
- In-Class Learning
- Corporate Learning
- Simulation-Based Learning
- Online On-the-Job Training
- Independent Learning
- By End-User
- Academic Institutes
- Corporate Enterprises
- By Provider Type
- Content Providers
- Service Providers
- By Geography
- North America
- United States
- Canada
- Mexico
- South America
- Brazil
- Argentina
- Rest of South America
- Europe
- Germany
- United Kingdom
- France
- Italy
- Spain
- Rest of Europe
- Asia-Pacific
- China
- Japan
- India
- South Korea
- ASEAN
- Rest of Asia-Pacific
- Middle East
- Saudi Arabia
- United Arab Emirates
- Rest of Middle East
- Africa
- South Africa
- Nigeria
- Rest of Africa
- North America
Geography Analysis
North America commanded 31.36% of 2025 global revenue, supported by clear FERPA guidance that eased data-sharing concerns for institutional deployments. Fortune 500 companies spend USD 1,200 per employee annually on mobile L&D, and Canada's federal directive to migrate all civil-service training to mobile platforms by 2027 adds USD 330 million in incremental procurement. Mexico's automotive clusters follow suit, rolling out Spanish-language apps for shift workers.
Asia Pacific is the fastest-growing arena at 18.15% CAGR to 2031, powered by India's DIKSHA platform's 6 billion sessions in 2024 and China's upcoming 2027 deadline for mobile-ready K-12 content. Japan earmarked JPY 240 billion (USD 1.6 billion) to retrofit public schools, and South Korea leverages domestic OEM strength - Samsung cut new-hire training costs 35% using internal mobile tools. Uneven infrastructure tempers gains in Indonesia and the Philippines, though offline-sync capabilities partly offset network gaps.
Europe trails at mid-teens growth due to GDPR compliance costs that average EUR 2.3 million (USD 2.6 million) per rollout. Germany's apprenticeship system integrates mobile modules, and the United Kingdom's visa points regime tied to digital credentials drove a 40% increase in micro-badge enrollments. South America, Middle East, and Africa remain longer-term plays yet reveal pilot momentum: Brazil equips 5,000 rural schools, Saudi Arabia allocates SAR 18 billion (USD 4.8 billion) under Vision 2030, and Nigeria mandates mobile content across 170 universities.
- SAP SE
- Microsoft Corporation
- Adobe Inc.
- Skillsoft Corporation
- Cisco Systems, Inc.
- Citrix Systems, Inc.
- Dell Technologies Inc.
- International Business Machines Corporation
- AT&T Inc.
- Upside Learning Solutions Pvt. Ltd.
- Learning Technologies Group plc
- Coursera Inc.
- Udemy, Inc.
- D2L Corporation
- Blackboard Inc.
- Docebo Inc.
- Cornerstone OnDemand, Inc.
- Pluralsight, Inc.
- 360Learning SA
- Allen Interactions Inc.
- Instructure Holdings, Inc.
- Google LLC
- Apple Inc.
- Oracle Corporation
- Promethean Limited
- NetDimensions Limited
Additional Benefits:
- The market estimate (ME) sheet in Excel format
- 3 months of analyst support
TABLE OF CONTENTS
1 INTRODUCTION
- 1.1 Study Assumptions and Market Definition
- 1.2 Scope of the Study
2 RESEARCH METHODOLOGY
3 EXECUTIVE SUMMARY
4 MARKET LANDSCAPE
- 4.1 Market Overview
- 4.2 Market Drivers
- 4.2.1 Rapid Adoption of Digital Learning Solutions in Corporate L&D
- 4.2.2 Bring-Your-Own-Device (BYOD) Policies Across Enterprises
- 4.2.3 Rising Global Penetration of Smartphones, Tablets and Laptops
- 4.2.4 Global 5G Roll-Out Enabling High-Definition Video and AR Mobile Courses
- 4.2.5 AI-driven Hyper-Personalised Micro-Learning Analytics Boosting ROI
- 4.2.6 Gig-economy Credential Portability Catalysing Mobile Micro-credentials
- 4.3 Market Restraints
- 4.3.1 High Upfront Investment in Mobile-ready Infrastructure
- 4.3.2 Data-security and Privacy Compliance Risks on Personal Devices
- 4.3.3 Device/OS Fragmentation Inflating Content-maintenance Costs
- 4.3.4 Smartphone Tariff Volatility and Supply-chain Constraints Raising TCO
- 4.4 Industry Value Chain Analysis
- 4.5 Regulatory Landscape
- 4.6 Technological Outlook
- 4.7 Porter's Five Forces Analysis
- 4.7.1 Bargaining Power of Suppliers
- 4.7.2 Bargaining Power of Buyers
- 4.7.3 Threat of New Entrants
- 4.7.4 Threat of Substitutes
- 4.7.5 Intensity of Competitive Rivalry
5 MARKET SIZE AND GROWTH FORECASTS (VALUE)
- 5.1 By Solution
- 5.1.1 E-Books
- 5.1.2 Interactive Assessment
- 5.1.3 Mobile and Video-Based Courseware
- 5.1.4 M-Enablement
- 5.1.5 Other Solutions
- 5.2 By Application
- 5.2.1 In-Class Learning
- 5.2.2 Corporate Learning
- 5.2.3 Simulation-Based Learning
- 5.2.4 Online On-the-Job Training
- 5.2.5 Independent Learning
- 5.3 By End-User
- 5.3.1 Academic Institutes
- 5.3.2 Corporate Enterprises
- 5.4 By Provider Type
- 5.4.1 Content Providers
- 5.4.2 Service Providers
- 5.5 By Geography
- 5.5.1 North America
- 5.5.1.1 United States
- 5.5.1.2 Canada
- 5.5.1.3 Mexico
- 5.5.2 South America
- 5.5.2.1 Brazil
- 5.5.2.2 Argentina
- 5.5.2.3 Rest of South America
- 5.5.3 Europe
- 5.5.3.1 Germany
- 5.5.3.2 United Kingdom
- 5.5.3.3 France
- 5.5.3.4 Italy
- 5.5.3.5 Spain
- 5.5.3.6 Rest of Europe
- 5.5.4 Asia-Pacific
- 5.5.4.1 China
- 5.5.4.2 Japan
- 5.5.4.3 India
- 5.5.4.4 South Korea
- 5.5.4.5 ASEAN
- 5.5.4.6 Rest of Asia-Pacific
- 5.5.5 Middle East
- 5.5.5.1 Saudi Arabia
- 5.5.5.2 United Arab Emirates
- 5.5.5.3 Rest of Middle East
- 5.5.6 Africa
- 5.5.6.1 South Africa
- 5.5.6.2 Nigeria
- 5.5.6.3 Rest of Africa
- 5.5.1 North America
6 COMPETITIVE LANDSCAPE
- 6.1 Market Concentration
- 6.2 Strategic Moves
- 6.3 Market Share Analysis
- 6.4 Company Profiles (includes Global level Overview, Market Level Overview, Core Segments, Financials as Available, Strategic Information, Market Rank/Share for Key Companies, Products and Services, and Recent Developments)
- 6.4.1 SAP SE
- 6.4.2 Microsoft Corporation
- 6.4.3 Adobe Inc.
- 6.4.4 Skillsoft Corporation
- 6.4.5 Cisco Systems, Inc.
- 6.4.6 Citrix Systems, Inc.
- 6.4.7 Dell Technologies Inc.
- 6.4.8 International Business Machines Corporation
- 6.4.9 AT&T Inc.
- 6.4.10 Upside Learning Solutions Pvt. Ltd.
- 6.4.11 Learning Technologies Group plc
- 6.4.12 Coursera Inc.
- 6.4.13 Udemy, Inc.
- 6.4.14 D2L Corporation
- 6.4.15 Blackboard Inc.
- 6.4.16 Docebo Inc.
- 6.4.17 Cornerstone OnDemand, Inc.
- 6.4.18 Pluralsight, Inc.
- 6.4.19 360Learning SA
- 6.4.20 Allen Interactions Inc.
- 6.4.21 Instructure Holdings, Inc.
- 6.4.22 Google LLC
- 6.4.23 Apple Inc.
- 6.4.24 Oracle Corporation
- 6.4.25 Promethean Limited
- 6.4.26 NetDimensions Limited
7 MARKET OPPORTUNITIES AND FUTURE OUTLOOK
- 7.1 White-space and Unmet-Need Assessment

