PUBLISHER: Mordor Intelligence | PRODUCT CODE: 2124546

PUBLISHER: Mordor Intelligence | PRODUCT CODE: 2124546
Security Assessment - Market Share Analysis, Industry Trends & Statistics, Growth Forecasts (2026 - 2031)
According to Mordor Intelligence, the security assessment market size is expected to grow from USD 4.87 billion in 2025 to USD 5.15 billion in 2026 and is forecast to reach USD 6.83 billion by 2031 at 5.78% CAGR over 2026-2031.
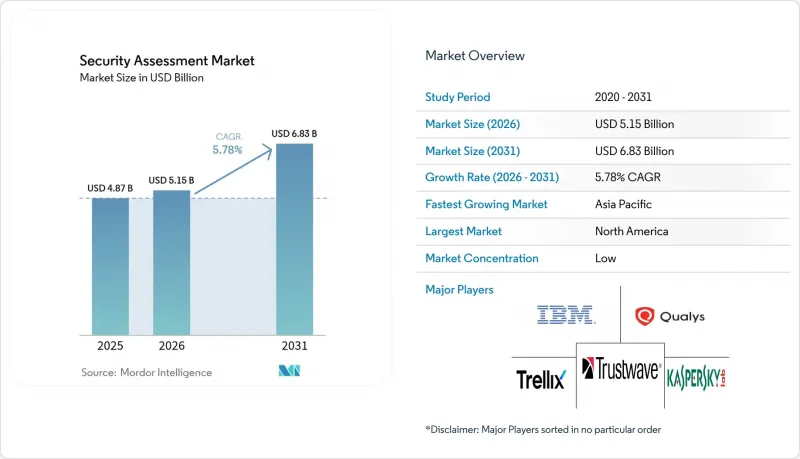
This report is Segmented by Service Type (Vulnerability Assessment, Penetration Testing, and More), Deployment Model (On-Premise, Cloud), Organization Size (Large Enterprises, Small and Medium-Sized Enterprises), End-User Vertical (IT and Telecom, BFSI, Retail and ECommerce, Healthcare and Lifesciences, and More), and Geography. The Market Forecasts are Provided in Terms of Value (USD).
Global Security Assessment Market Trends and Insights
Growing Volume and Sophistication of Phishing/Malware Attacks
Ransomware strikes on healthcare providers jumped 137% within 18 months, compelling firms to rethink assessment methods beyond annual checklists. Attackers now pivot tactics within days of patch releases, so enterprises are deploying continuous breach simulation that mirrors adversary behavior instead of static scans. Asia-Pacific records the highest median dwell times globally, exposing response gaps that specialized assessment services must close. Providers delivering AI-backed threat emulation and red-team exercises see rising engagement as clients demand realistic validation over routine vulnerability sweeps.
Regulatory Compliance Mandates Expanding to Mid-Market
The Digital Operational Resilience Act, live since January 2025, obliges more than 22,000 EU financial firms to run regular resilience testing, extending obligations from major banks to mid-tier entities. In the United States, regulators signal baseline resilience requirements that incorporate third-party risk programs, pushing fresh demand for assessment among regional banks. Proposed HIPAA security updates further require multi-factor authentication and yearly audits, projecting USD 9 billion first-year compliance costs. These broadening mandates stabilize service demand by transforming compliance from episodic to ongoing.
Budget Constraints in SMB Segment
Small firms devote near 4% of revenue to security yet face disproportionate breach rates, with 56% of Asia-Pacific SMEs reporting incidents and 75% suffering customer data loss. Full-spectrum testing often exceeds available budgets, pushing many toward basic scanners and leaving gaps in threat coverage. Affordability concerns therefore cap near-term expansion, but they also spur innovation in automated, subscription-priced platforms that lower delivery costs.
Other drivers and restraints analyzed in the detailed report include:
- Surging Cloud Migration Creating Demand for Continuous Validation
- AI-Enabled Automated Testing Platforms Lowering Cost and Cycle Time
- Shortage of Skilled Red-Team/Pentest Talent
For complete list of drivers and restraints, kindly check the Table Of Contents.
Segment Analysis
Vulnerability assessment held 33.02% of 2025 revenue, underscoring its foundational role in compliance programs. PTaaS, however, will scale fastest at 7.18% CAGR, mirroring a market pivot to ongoing validation aligned with DevOps. Many enterprises transition from yearly pentests to monthly or sprint-driven exercises. Risk and compliance audits sustain steady uptake thanks to DORA and HIPAA revisions.
Demand for cloud configuration assessment is rising as multi-cloud estates proliferate. Vendors embedding APIs into CI/CD pipelines create durable advantage, replacing lengthy consulting cycles with real-time dashboards. Mainstream adoption of AI-assisted exploit generation further shifts buyer expectations toward speed over labor hours. Providers offering hybrid models-automated discovery plus analyst validation-balance efficiency and accuracy, appealing to risk-averse sectors like BFSI and healthcare.
On-premise testing environments, mandatory for certain financial and government clients, delivered 51.65% revenue in 2025. Nonetheless, cloud-delivered assessment platforms will post an 7.97% CAGR to 2031. Elastic scale, remote collaboration, and integration with cloud-native workloads drive uptake. The FedRAMP 20x roadmap shows public-sector appetite for continuous cloud monitoring, and private enterprises follow suit. Multi-tenant SaaS assessment reduces infrastructure overhead for clients and accelerates updates.
Providers differentiating through multi-cloud visibility and API openness secure longer-term contracts. Conversely, purely on-premise tools risk obsolescence as hybrid workforces and edge deployments expand. Where data-sovereignty regulations persist, vendors increasingly position sovereign SaaS regions rather than hard-air-gapped appliances to retain regulated customers.
Complete Report Scope:
- By Service Type
- Vulnerability Assessment
- Penetration Testing
- Risk and Compliance Audit
- Red-/Purple-Team Simulation
- Cloud Configuration Assessment
- By Deployment Model
- On-Premise
- Cloud
- By Organization Size
- Large Enterprises
- Small and Medium-Sized Enterprises (SMEs)
- By End-user Industry
- BFSI
- IT and Telecom
- Healthcare and Life Sciences
- Retail and eCommerce
- Energy and Utilities
- Government and Defense
- Others (Education, Media, etc.)
- By Geography
- North America
- United States
- Canada
- Mexico
- South America
- Brazil
- Argentina
- Rest of South America
- Europe
- Germany
- United Kingdom
- France
- Italy
- Spain
- Netherlands
- Russia
- Rest of Europe
- Asia-Pacific
- China
- Japan
- India
- South Korea
- South East Asia
- Australia and New Zealand
- Rest of Asia-Pacific
- Middle East and Africa
- Middle East
- Saudi Arabia
- United Arab Emirates
- Turkey
- Rest of Middle East
- Africa
- South Africa
- Nigeria
- Egypt
- Rest of Africa
- Middle East
- North America
Geography Analysis
North America produced 40.88% of 2025 revenue owing to deep budgets and far-reaching regulations. FedRAMP 20x and potential federal resilience baselines spur federal and banking sectors to adopt continuous monitoring. Canada aligns breach-notification rules with its USMCA partners, while Mexico's 2024 data-protection statute elevates demand for standardized assessment across supply chains.
Asia-Pacific is the growth engine with an 8.27% CAGR through 2031. Rapid cloud adoption, e-commerce expansion, and heightened geopolitical tensions lift spending. Australia's five-year cybersecurity accord with Microsoft and Japan's defense-oriented cyber build-out illustrate capital infusion. The region's 2.1 million talent gap and prolonged dwell times create appetite for managed and automated services that offset staffing deficits. SMEs particularly favor subscription-delivered testing platforms to close exposure gaps without heavy capex.
Europe remains sizable through sweeping legislation. DORA reaches thousands of financial entities, while NIS2 widens compulsory security controls across utilities and digital providers. The region's strict data-sovereignty stance directs demand toward localized cloud nodes and encrypted data storage within assessments. United Kingdom operational-resilience rules converge with EU statutes, simplifying pan-European compliance roadmaps for multinational banks.
Latin America, Middle East, and Africa show nascent yet accelerating uptake as cyber incidents escalate and governments draft national strategies. Gulf Cooperation Council states invest in sovereign cloud zones, driving local assessment demand. South American power utilities prioritize critical-infrastructure audits following headline ransomware incidents. Budget limitations still temper immediate revenue, but vendor partnerships with regional integrators lay groundwork for mid-term expansion.
- IBM Corporation
- Accenture PLC
- Cisco Systems Inc.
- Rapid7 Inc.
- Qualys Inc.
- Check Point Software Technologies Ltd.
- Trustwave (Singtel)
- Optiv Security Inc.
- Mandiant (Google Cloud)
- Secureworks Inc.
- Synopsys Inc.
- CrowdStrike Holdings Inc.
- Fortinet Inc.
- Palo Alto Networks Inc.
- Tenable Holdings Inc.
- Veracode
- Snyk Ltd.
- Absolute Software Corp.
- Holm Security
- Kaspersky Lab
- FireEye/Trellix
Additional Benefits:
- The market estimate (ME) sheet in Excel format
- 3 months of analyst support
TABLE OF CONTENTS
1 INTRODUCTION
- 1.1 Study Assumptions and Market Definition
- 1.2 Scope of the Study
2 RESEARCH METHODOLOGY
3 EXECUTIVE SUMMARY
4 MARKET LANDSCAPE
- 4.1 Market Overview
- 4.2 Market Drivers
- 4.2.1 Growing volume and sophistication of phishing/malware attacks
- 4.2.2 Regulatory compliance mandates expanding to mid-market (e.g., DORA, OCC resilience rules)
- 4.2.3 Surging cloud migration driving continuous security validation demand
- 4.2.4 AI-enabled automated testing platforms lowering cost and cycle time
- 4.2.5 Pen-Testing-as-a-Service (PTaaS) adoption among SaaS vendors
- 4.2.6 Convergence of DevSecOps and shift-left security testing
- 4.3 Market Restraints
- 4.3.1 Budget constraints in SMB segment
- 4.3.2 Shortage of skilled red-team/pentest talent
- 4.3.3 Tool sprawl leading to assessment fatigue" and alert overload"
- 4.3.4 Accuracy concerns around Gen-AI-driven assessment engines
- 4.4 Industry Ecosystem Analysis
- 4.5 Technological Outlook
- 4.6 Porter's Five Forces Analysis
- 4.6.1 Threat of New Entrants
- 4.6.2 Bargaining Power of Buyers
- 4.6.3 Bargaining Power of Suppliers
- 4.6.4 Threat of Substitutes
- 4.6.5 Intensity of Competitive Rivalry
5 MARKET SIZE AND GROWTH FORECASTS (VALUES)
- 5.1 By Service Type
- 5.1.1 Vulnerability Assessment
- 5.1.2 Penetration Testing
- 5.1.3 Risk and Compliance Audit
- 5.1.4 Red-/Purple-Team Simulation
- 5.1.5 Cloud Configuration Assessment
- 5.2 By Deployment Model
- 5.2.1 On-Premise
- 5.2.2 Cloud
- 5.3 By Organization Size
- 5.3.1 Large Enterprises
- 5.3.2 Small and Medium-Sized Enterprises (SMEs)
- 5.4 By End-user Industry
- 5.4.1 BFSI
- 5.4.2 IT and Telecom
- 5.4.3 Healthcare and Life Sciences
- 5.4.4 Retail and eCommerce
- 5.4.5 Energy and Utilities
- 5.4.6 Government and Defense
- 5.4.7 Others (Education, Media, etc.)
- 5.5 By Geography
- 5.5.1 North America
- 5.5.1.1 United States
- 5.5.1.2 Canada
- 5.5.1.3 Mexico
- 5.5.2 South America
- 5.5.2.1 Brazil
- 5.5.2.2 Argentina
- 5.5.2.3 Rest of South America
- 5.5.3 Europe
- 5.5.3.1 Germany
- 5.5.3.2 United Kingdom
- 5.5.3.3 France
- 5.5.3.4 Italy
- 5.5.3.5 Spain
- 5.5.3.6 Netherlands
- 5.5.3.7 Russia
- 5.5.3.8 Rest of Europe
- 5.5.4 Asia-Pacific
- 5.5.4.1 China
- 5.5.4.2 Japan
- 5.5.4.3 India
- 5.5.4.4 South Korea
- 5.5.4.5 South East Asia
- 5.5.4.6 Australia and New Zealand
- 5.5.4.7 Rest of Asia-Pacific
- 5.5.5 Middle East and Africa
- 5.5.5.1 Middle East
- 5.5.5.1.1 Saudi Arabia
- 5.5.5.1.2 United Arab Emirates
- 5.5.5.1.3 Turkey
- 5.5.5.1.4 Rest of Middle East
- 5.5.5.2 Africa
- 5.5.5.2.1 South Africa
- 5.5.5.2.2 Nigeria
- 5.5.5.2.3 Egypt
- 5.5.5.2.4 Rest of Africa
- 5.5.5.1 Middle East
- 5.5.1 North America
6 COMPETITIVE LANDSCAPE
- 6.1 Market Concentration
- 6.2 Strategic Moves
- 6.3 Market Share Analysis
- 6.4 Company Profiles (includes Global level Overview, Market level overview, Core Segments, Financials as available, Strategic Information, Market Rank/Share, Products and Services, Recent Developments)
- 6.4.1 IBM Corporation
- 6.4.2 Accenture PLC
- 6.4.3 Cisco Systems Inc.
- 6.4.4 Rapid7 Inc.
- 6.4.5 Qualys Inc.
- 6.4.6 Check Point Software Technologies Ltd.
- 6.4.7 Trustwave (Singtel)
- 6.4.8 Optiv Security Inc.
- 6.4.9 Mandiant (Google Cloud)
- 6.4.10 Secureworks Inc.
- 6.4.11 Synopsys Inc.
- 6.4.12 CrowdStrike Holdings Inc.
- 6.4.13 Fortinet Inc.
- 6.4.14 Palo Alto Networks Inc.
- 6.4.15 Tenable Holdings Inc.
- 6.4.16 Veracode
- 6.4.17 Snyk Ltd.
- 6.4.18 Absolute Software Corp.
- 6.4.19 Holm Security
- 6.4.20 Kaspersky Lab
- 6.4.21 FireEye/Trellix
7 MARKET OPPORTUNITIES AND FUTURE OUTLOOK
- 7.1 White-space and Unmet-need Assessment

