PUBLISHER: Mordor Intelligence | PRODUCT CODE: 2124571

PUBLISHER: Mordor Intelligence | PRODUCT CODE: 2124571
Deep Packet Inspection And Processing - Market Share Analysis, Industry Trends & Statistics, Growth Forecasts (2026 - 2031)
According to Mordor Intelligence, the deep packet inspection market size is valued at USD 41.42 billion in 2026 and is projected to reach USD 83.77 billion by 2031, translating into a 15.13% CAGR.
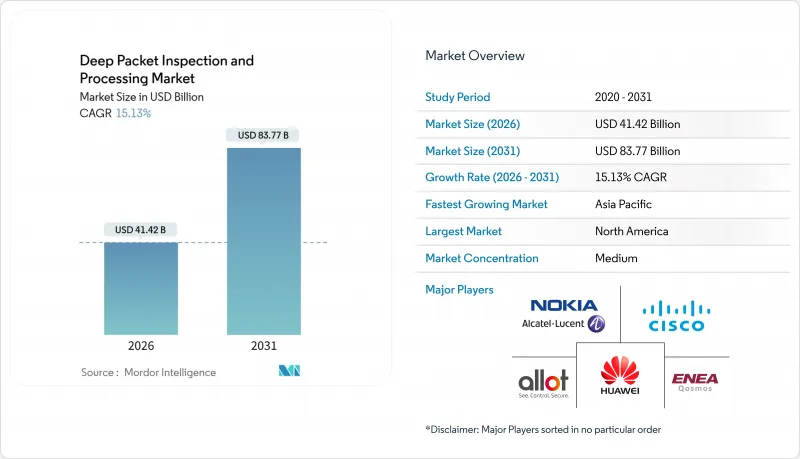
This report is Segmented by Solution (Hardware, and Software), Deployment Mode (On-Premise, and Cloud/SaaS), Application (Traffic Management and QoS, Intrusion Detection/Prevention, and More), End-User (Telecom and IT Providers, BFSI, and More), Organization Size (Large Enterprises, and SMEs), and Geography. The Market Forecasts are Provided in Terms of Value (USD).
Global Deep Packet Inspection And Processing Market Trends and Insights
Surge in Encrypted Traffic Visibility Tools
TLS 1.3 removed the certificate exchange that legacy engines parsed for application fingerprinting, prompting vendors to ship analytics that exploit cipher-suite patterns, certificate lifetimes, and handshake timing instead of payload decryption. Cisco's Encrypted Traffic Analytics and ipoque's Encrypted Traffic Intelligence now classify more than 4,000 applications with 95% accuracy, allowing banks to uncover data-exfiltration attempts inside fully encrypted sessions. The U.S. National Institute of Standards and Technology endorsed this approach in its 2024 guidelines, balancing monitoring needs with privacy preservation. Enterprises adopting these tools in 2025 shortened mean-time-to-detect advanced threats by 34%, freeing analyst hours for remediation work.
5G Network Slicing Driving Policy-Aware DPI
Standalone 5G cores disaggregate control and user planes, enabling operators to sell dedicated slices for autonomous driving, industrial automation, and augmented reality. Each slice carries its own latency and reliability envelope, so packets must be inspected inline to enforce service-level thresholds that can fall below 1 millisecond for ultra-reliable low-latency communications. Nokia's MX Industrial Edge embeds DPI inside the user-plane function, cutting processing latency by 40% versus legacy service-chaining. Japanese and South Korean operators that implemented policy-aware DPI in 2025 monetized premium slices at USD 1.8-2.3 per subscriber per month, offsetting heavy spectrum outlays.
Privacy Backlash and DPI Transparency Mandates
Article 5 of the General Data Protection Regulation requires transparent handling of personal data, yet DPI inevitably processes payloads that may hold identifiers such as email addresses and location metadata. Civil-liberties groups filed complaints in 2025 against three European operators, asserting unlawful profiling through DPI-derived analytics. The European Data Protection Board responded with guidance that obliges operators to publish data-processing impact assessments detailing inspected fields and retention periods, a disclosure burden that legal teams estimate will cost USD 2-4 million per carrier. California's Consumer Privacy Act amendments carried similar obligations in 2024, forcing U.S. providers to embed consent workflows into inspection platforms. Operators failing to demonstrate lawful basis faced average penalties of USD 1.2 million per incident in 2025, nudging some toward less intrusive analytics models.
Other drivers and restraints analyzed in the detailed report include:
- AI-Powered Traffic Analytics for Zero-Trust Security
- Integration of DPI with SASE Platforms
- Increasing TLS 1.3 / QUIC Adoption Limits Payload View
For complete list of drivers and restraints, kindly check the Table Of Contents.
Segment Analysis
Hardware platforms retained a 62.32% share of the deep packet inspection market in 2025 because telecom operators refreshed appliance fleets with 400-gigabit products that keep encrypted traffic at line rate.[3] Cisco's Catalyst 9000 switches and Juniper's MX routers integrate acceleration blocks, eliminating the need for external taps. In parallel, software solutions are projected to grow at an 18.41% CAGR through 2031 as cloud-native deployments spin up containerized inspection instances on commodity servers. Enterprises running Fortinet's FortiGate virtual machines autoscale capacity during e-commerce peaks, paying only for the compute they consume. This pivot mirrors the broader network-function-virtualization wave that slashed operator capex by 28% in European trials completed during 2025.
Hybrid topologies are taking hold. Banks anchor their data-center perimeters with 100 Gbps hardware appliances, while lightweight agents monitor east-west traffic inside Kubernetes clusters, feeding orchestration engines such as Terraform for instant policy rollouts. Open-source libraries like nDPI and libprotoident gained traction among managed-service providers crafting differentiated analytics layers, eroding the defensive moat that once came from proprietary parsing alone. As basic inspection commoditizes, vendors differentiate on threat-intel feeds and machine-learning precision, setting the stage for convergence with security analytics platforms.
On-premise systems accounted for 71.51% of 2025 revenue, a figure shaped by banking and government rules that forbid routing sensitive flows through third-party clouds. The Payment Card Industry Data Security Standard compels card processors to keep inspection inside PCI-compliant facilities, locking them into appliance refresh cycles. Conversely, cloud and software-as-a-service adoption is forecast at a 17.23% CAGR as mid-market firms opt for subscription pricing that starts near USD 15 per user per year, far below the six-figure capital outlays for hardware.
Latency remains the stumbling block. Backhauling branch traffic to regional scrubbing hubs can add 8-15 milliseconds, enough to degrade VoIP or disrupt algorithmic trading. Vendors responded by dropping micro-data centers at internet-exchange points across 310 cities, keeping 95% of users within 50 milliseconds of inspection nodes. A split-tunnel compromise has emerged; enterprises keep sensitive workloads on-prem while sending web traffic to cloud inspection, giving rise to hybrid designs now adopted by 62% of Palo Alto Networks' SASE customers.
Complete Report Scope:
- By Solution
- Hardware
- Software
- By Deployment Mode
- On-Premise
- Cloud / SaaS
- By Application
- Traffic Management and QoS
- Intrusion Detection / Prevention
- Data Retention and Lawful Interception
- Network Performance Monitoring
- By End-User
- Telecom and IT Providers
- BFSI
- Healthcare
- Retail and eCommerce
- Government and Public Safety
- By Organization Size
- Large Enterprises (?1,000 Employees)
- SMEs
- By Geography
- North America
- United States
- Canada
- Mexico
- Europe
- Germany
- United Kingdom
- France
- Italy
- Spain
- Russia
- Rest of Europe
- Asia Pacific
- China
- Japan
- India
- South Korea
- ASEAN
- Australia and New Zealand
- Rest of Asia Pacific
- South America
- Brazil
- Argentina
- Rest of South America
- Middle East
- Saudi Arabia
- UAE
- Turkey
- Rest of Middle East
- Africa
- South Africa
- Nigeria
- Rest of Africa
- North America
Geography Analysis
North America retained 33.26% share of 2025 spending in the deep packet inspection market, buoyed by hyperscale cloud builders and Wall Street institutions that demand sub-millisecond telemetry to protect algorithmic trades. Robust fiber backbones and dense IXPs minimize latency penalties, allowing operators to run terabit inline inspection without degrading user experience. Federal guidance published in 2024 compels firms to detect breaches within 30 days, anchoring zero-trust rollouts that rely on continuous packet visibility. Nonetheless, state-level privacy laws such as California's CCPA add USD 1.8-2.4 million in compliance costs per operator, nudging some workloads toward less granular analytics models.
Asia Pacific is forecast to log a 16.19% CAGR, the fastest among major regions, as India's carriers invest USD 19 billion in 5G spectrum and deploy standalone cores with inline DPI for slice monetization. China's Cybersecurity Law obliges domestic data storage and 24-hour law-enforcement access, generating USD 2.1 billion in 2025 DPI procurement for national carriers. Japan's Ministry of Internal Affairs and Communications published technical standards in 2025 that link DPI to slice quality-of-service identifiers, enabling carriers to charge premium fees for ultra-reliable services. South Korea's operators layered AI over DPI to slash distributed-denial-of-service outage minutes by 38% in 2025, proving the business case for machine-learning inspection at scale.
Europe balances strong demand with stringent compliance. GDPR transparency mandates clash with the EU Data Retention Directive, forcing operators to anonymize subscriber IDs in exported records, an engineering overhaul that cost north of USD 15 million per tier-one carrier in 2025. Meanwhile, Middle Eastern regulators in Saudi Arabia and the UAE require lawful intercept by design, keeping contract pipelines open for niche vendors that can certify ETSI compliance. South America and Africa trail in both capital budgets and broadband penetration, yet Brazil's draft 5G security rules and South Africa's spectrum licenses include inspection clauses that signal latent demand for 2027-2030 deployments.
- Cisco Systems, Inc.
- Nokia Corporation
- Huawei Technologies Co., Ltd.
- Allot Ltd.
- Enea AB
- Sandvine Corporation
- Bivio Networks, Inc.
- ipoque GmbH
- SolarWinds Worldwide, LLC
- Zoho Corporation Pvt. Ltd.
- AppNeta, Inc.
- Netify Inc.
- Fortinet, Inc.
- Juniper Networks, Inc.
- NETSCOUT Systems, Inc.
- Palo Alto Networks, Inc.
- Check Point Software Technologies Ltd.
- Procera Networks, Inc.
- WiseSpot Ltd.
- Utimaco IS GmbH
- Trend Micro Incorporated
- Zscaler, Inc.
Additional Benefits:
- The market estimate (ME) sheet in Excel format
- 3 months of analyst support
TABLE OF CONTENTS
1 INTRODUCTION
- 1.1 Study Assumptions and Market Definition
- 1.2 Scope of the Study
2 RESEARCH METHODOLOGY
3 EXECUTIVE SUMMARY
4 MARKET LANDSCAPE
- 4.1 Market Overview
- 4.2 Market Drivers
- 4.2.1 Surge in Encrypted Traffic Visibility Tools
- 4.2.2 5G Network Slicing Driving Policy-Aware DPI
- 4.2.3 Mandatory Data-Retention and Lawful-Intercept Laws
- 4.2.4 AI-Powered Traffic Analytics for Zero-Trust Security
- 4.2.5 Edge and IoT Micro-Segmentation Requirements
- 4.2.6 Integration of DPI with SASE Platforms
- 4.3 Market Restraints
- 4.3.1 Privacy Backlash and DPI Transparency Mandates
- 4.3.2 Increasing TLS 1.3 / QUIC Adoption Limits Payload View
- 4.3.3 High Capex for Tera-Scale Inline Inspection
- 4.3.4 Evasive Techniques (Encrypted SNI, Obfuscation) Reduce DPI Efficacy
- 4.4 Impact of Macroeconomic Factors on the Market
- 4.5 Industry Value Chain Analysis
- 4.6 Regulatory Landscape
- 4.7 Technological Outlook
- 4.8 Porter's Five Forces Analysis
- 4.8.1 Bargaining Power of Buyers
- 4.8.2 Bargaining Power of Suppliers
- 4.8.3 Threat of New Entrants
- 4.8.4 Threat of Substitutes
- 4.8.5 Intensity of Competitive Rivalry
5 MARKET SIZE AND GROWTH FORECASTS (VALUE)
- 5.1 By Solution
- 5.1.1 Hardware
- 5.1.2 Software
- 5.2 By Deployment Mode
- 5.2.1 On-Premise
- 5.2.2 Cloud / SaaS
- 5.3 By Application
- 5.3.1 Traffic Management and QoS
- 5.3.2 Intrusion Detection / Prevention
- 5.3.3 Data Retention and Lawful Interception
- 5.3.4 Network Performance Monitoring
- 5.4 By End-User
- 5.4.1 Telecom and IT Providers
- 5.4.2 BFSI
- 5.4.3 Healthcare
- 5.4.4 Retail and eCommerce
- 5.4.5 Government and Public Safety
- 5.5 By Organization Size
- 5.5.1 Large Enterprises (?1,000 Employees)
- 5.5.2 SMEs
- 5.6 By Geography
- 5.6.1 North America
- 5.6.1.1 United States
- 5.6.1.2 Canada
- 5.6.1.3 Mexico
- 5.6.2 Europe
- 5.6.2.1 Germany
- 5.6.2.2 United Kingdom
- 5.6.2.3 France
- 5.6.2.4 Italy
- 5.6.2.5 Spain
- 5.6.2.6 Russia
- 5.6.2.7 Rest of Europe
- 5.6.3 Asia Pacific
- 5.6.3.1 China
- 5.6.3.2 Japan
- 5.6.3.3 India
- 5.6.3.4 South Korea
- 5.6.3.5 ASEAN
- 5.6.3.6 Australia and New Zealand
- 5.6.3.7 Rest of Asia Pacific
- 5.6.4 South America
- 5.6.4.1 Brazil
- 5.6.4.2 Argentina
- 5.6.4.3 Rest of South America
- 5.6.5 Middle East
- 5.6.5.1 Saudi Arabia
- 5.6.5.2 UAE
- 5.6.5.3 Turkey
- 5.6.5.4 Rest of Middle East
- 5.6.6 Africa
- 5.6.6.1 South Africa
- 5.6.6.2 Nigeria
- 5.6.6.3 Rest of Africa
- 5.6.1 North America
6 COMPETITIVE LANDSCAPE
- 6.1 Market Concentration
- 6.2 Strategic Moves
- 6.3 Market Share Analysis
- 6.4 Company Profiles (includes Global Level Overview, Market Level Overview, Core Segments, Financials as available, Strategic Information, Market Rank/Share for Key Companies, Products and Services, and Recent Developments)
- 6.4.1 Cisco Systems, Inc.
- 6.4.2 Nokia Corporation
- 6.4.3 Huawei Technologies Co., Ltd.
- 6.4.4 Allot Ltd.
- 6.4.5 Enea AB
- 6.4.6 Sandvine Corporation
- 6.4.7 Bivio Networks, Inc.
- 6.4.8 ipoque GmbH
- 6.4.9 SolarWinds Worldwide, LLC
- 6.4.10 Zoho Corporation Pvt. Ltd.
- 6.4.11 AppNeta, Inc.
- 6.4.12 Netify Inc.
- 6.4.13 Fortinet, Inc.
- 6.4.14 Juniper Networks, Inc.
- 6.4.15 NETSCOUT Systems, Inc.
- 6.4.16 Palo Alto Networks, Inc.
- 6.4.17 Check Point Software Technologies Ltd.
- 6.4.18 Procera Networks, Inc.
- 6.4.19 WiseSpot Ltd.
- 6.4.20 Utimaco IS GmbH
- 6.4.21 Trend Micro Incorporated
- 6.4.22 Zscaler, Inc.
7 MARKET OPPORTUNITIES AND FUTURE OUTLOOK
- 7.1 White-space and Unmet-Need Assessment

