PUBLISHER: Mordor Intelligence | PRODUCT CODE: 2124631

PUBLISHER: Mordor Intelligence | PRODUCT CODE: 2124631
Flow Meters - Market Share Analysis, Industry Trends & Statistics, Growth Forecasts (2026 - 2031)
According to Mordor Intelligence, the flow meters market size is valued at USD 8.93 billion in 2026 and is projected to reach USD 11.33 billion by 2031, reflecting a 4.88% CAGR over the forecast period.
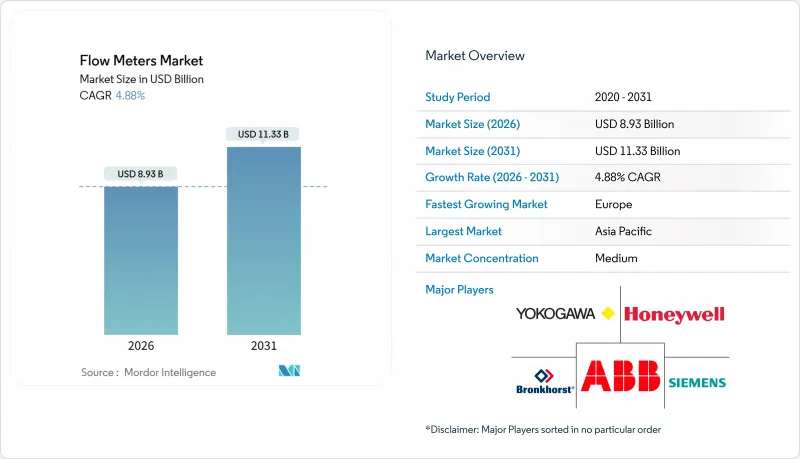
This report is Segmented by Technology (Volumetric, and Mass), Mounting (In-Line, Clamp-On, and Insertion), Fluid Type (Liquid, Gas, and Steam), End-User Industry (Oil and Gas, Water and Wastewater, Chemicals, Power, Food and Beverage, and Pharmaceuticals), and Geography (North America, South America, Europe, Asia-Pacific, Middle East, Africa). Market Forecasts are Provided in Value (USD).
Global Flow Meters Market Trends and Insights
IoT-Enabled Process Automation For Real-Time Flow Analytics
Industrial sites are upgrading meters so that each device becomes an edge-computing node delivering one-second interval data streams. Platforms such as Yokogawa OpreX analyze drift and cavitation, then automatically adjust control valves to maintain +-0.5% set-points. Pharmaceutical continuous-manufacturing lines rely on the same feedback loops to stay within U.S. Food and Drug Administration process analytical technology guidelines. Siemens disclosed that predictive analytics embedded in its ultrasonic meters cut unscheduled chemical-plant downtime by 22% in 2025. Real-time visibility also links with enterprise software; a European beverage producer tied electromagnetic meters to SAP S/4HANA and trimmed raw-material waste by 14%.
Global Water And Wastewater Infrastructure Investments
Utilities losing 25% to 40% of treated water to leaks are replacing mechanical meters with battery-powered ultrasonic and electromagnetic alternatives. China earmarked CNY 150 billion (USD 21 billion) in 2025 to digitize networks across 100 cities. India's Jal Jeevan Mission introduced prepaid meters that lowered non-revenue water from 42% to 28% in Jaipur within 18 months. In the United States, USD 55 billion from the Bipartisan Infrastructure Law channels funding toward hourly-data advanced metering installations. European consulting estimates show potential recovery of EUR 8 billion annually if smart meters eliminate undetected losses.
High CAPEX Of Advanced Coriolis And Ultrasonic Meters
Acquisition prices run three to ten times higher than electromagnetic or vortex alternatives, prompting cash-constrained utilities to delay upgrades. A 4-inch Coriolis meter can cost USD 12,000-18,000, compared with USD 2,500-4,000 for an electromagnetic counterpart. Specialized mounting, vibration-isolation, and zeroing steps add another USD 3,000-5,000 to commissioning. Lifecycle economics favor premium meters, but procurement teams often concentrate on upfront budgets. Subscription-based meter-as-a-service offerings are emerging to convert capital expense into operating expense and accelerate adoption.
Other drivers and restraints analyzed in the detailed report include:
- Energy-Sector Safety And Accuracy Compliance Mandates
- Brownfield Demand For Battery-Powered Clamp-On Retrofits
- Cyber-Security Exposure Of Wireless Smart Meters
For complete list of drivers and restraints, kindly check the Table Of Contents.
Segment Analysis
Mass-based methods accounted for USD 2.6 billion in 2025 and are advancing at a 7.4% CAGR. The flow meters market benefits as hydrogen blending and carbon-capture sequestration demand direct mass measurement immune to density shifts. Coriolis meters have become the default choice for liquefied CO2 custody transfer, illustrated by the Northern Lights CCS project in Norway, which operates at 100 bar with +-0.05% uncertainty. Ultrasonic designs are displacing turbines in gas distribution because they keep +-1.5% accuracy when hydrogen reaches 20% of volume.
Volumetric technologies still hold 28.9% of 2025 revenue, anchored by electromagnetic meters in municipal water networks. Differential-pressure orifice plates remain common in steam lines, though they require 10-20 diameters of straight pipe. Thermal mass sensors are flourishing in biogas and compressed-air loops, where low flow rates compromise turbine performance. Positive-displacement units persist in fuel-dispensing and viscous-liquid batching. Vortex meters offer a mid-price, low-maintenance option for power-plant steam. Collectively, these trends underscore a structural rotation inside the flow meters industry toward high-accuracy, self-diagnosing devices that integrate seamlessly with digital-twin software.
In-line hardware represented 48.2% of 2025 revenue but is growing at a slower 4.2% pace because brownfield sites face downtime penalties if pipes are cut. Clamp-on variants, by contrast, are expanding at 5.9% and permit installation without depressurization. A North American midstream operator retrofitted 120 lines in eight weeks using clamp-on ultrasonic devices at 62% lower cost than in-line alternatives. Insertion probes, which penetrate but do not replace pipe sections, are finding niches in large-diameter water mains.
Battery innovations extend field life to 10-15 years, letting meters act as wireless IoT nodes. Functional-safety certification for Safety Integrity Level 2 has widened the addressable market to nuclear and pharmaceutical plants. Still, custody-transfer points continue to rely on in-line meters that deliver +-0.1% certainty. The flow meters market now segments by tolerance as much as by mechanics, with end users balancing cost, accuracy and downtime avoidance.
Complete Report Scope:
- By Technology
- Volumetric
- Differential Pressure
- Electromagnetic
- Ultrasonic
- Turbine
- Positive Displacement
- Vortex
- Mass
- Coriolis
- Thermal Mass
- Volumetric
- By Mounting/Installation
- In-Line
- Clamp-On/External
- Insertion
- By Fluid Type
- Liquid
- Gas
- Steam
- By End-User Industry
- Oil and Gas
- Water and Wastewater
- Chemical and Petrochemical
- Power Generation
- Food and Beverage
- Pulp and Paper
- Pharmaceuticals and Biotechnology
- Metals and Mining
- Other End-User Industries
- By Geography
- North America
- United States
- Canada
- Mexico
- South America
- Brazil
- Argentina
- Rest of South America
- Europe
- Germany
- United Kingdom
- France
- Italy
- Spain
- Rest of Europe
- Asia-Pacific
- China
- India
- Japan
- South Korea
- Australia and New Zealand
- Rest of Asia-Pacific
- Middle East
- Saudi Arabia
- United Arab Emirates
- Turkey
- Rest of Middle East
- Africa
- South Africa
- Nigeria
- Egypt
- Rest of Africa
- North America
Geography Analysis
Asia-Pacific accounted for 38.9% of 2025 revenue, powered by China's CNY 150 billion smart-water initiative and India's leak-detection mandates. Japan leverages edge-computing analytics in chemical and electronics plants, while South Korea fits thermal mass sensors in expanding semiconductor fabs. Growth also reflects large-scale hydrogen pilot pipelines in Australia and LNG export expansion in Malaysia.
Europe is forecast to lead growth at a 5.3% CAGR. Germany's hydrogen-blend rule moves millions of meters to ultrasonic technology, Denmark's district-heating networks install heat meters to comply with European Union energy-efficiency regulations, and the United Kingdom pursues a 50% leakage-reduction goal that stimulates smart-meter procurement. Additionally, Norway's CCS projects and France's hydrogen stations accelerate demand for custody-transfer Coriolis devices.
North America grows at 4.6% as the United States directs USD 55 billion to water infrastructure and midstream oil operators modernize custody meters. The Middle East invests heavily in desalination, using electromagnetic devices to monitor feedwater and brine. South America's prospects improve after Brazilian utility privatizations unlock smart-meter funding, while Africa shows selective progress with prepaid municipal installations in South Africa and pilot bulk-supply meters in Nigeria. Collectively, these regional programs underpin a broad global baseline for the flow meters market.
- Azbil Corporation
- Badger Meter Inc.
- Bronkhorst High-Tech BV
- Brooks Instrument (ITW)
- Christian Burkert GmbH and Co. KG
- Danfoss A/S
- Dwyer Instruments LLC
- Emerson Electric Co.
- Endress+Hauser AG
- Honeywell International Inc.
- Keyence Corporation
- KROHNE Messtechnik GmbH
- Schneider Electric SE
- Sensirion AG
- Siemens AG
- SICK AG
- TSI Incorporated
- Yokogawa Electric Corporation
- ABB Ltd
Additional Benefits:
- The market estimate (ME) sheet in Excel format
- 3 months of analyst support
TABLE OF CONTENTS
1 INTRODUCTION
- 1.1 Study Assumptions and Market Definition
- 1.2 Scope of the Study
2 RESEARCH METHODOLOGY
3 EXECUTIVE SUMMARY
4 MARKET LANDSCAPE
- 4.1 Market Overview
- 4.2 Market Drivers
- 4.2.1 IoT-enabled Process Automation for Real-Time Flow Analytics
- 4.2.2 Global Water and Wastewater Infrastructure Investments
- 4.2.3 Energy-Sector Safety and Accuracy Compliance Mandates
- 4.2.4 Brownfield Demand for Battery-Powered Clamp-On Retrofits
- 4.2.5 Multiphase-Flow Metering Needs in CCUS Projects
- 4.2.6 District Heating/Cooling Smart-Meter Roll-Outs
- 4.3 Market Restraints
- 4.3.1 High CAPEX of Advanced Coriolis and Ultrasonic Meters
- 4.3.2 Skilled-Calibration and Maintenance Talent Shortage
- 4.3.3 Cyber-Security Exposure of Wireless Smart Meters
- 4.3.4 Semiconductor Shortages for Ultrasonic Transducers
- 4.4 Industry Value Chain Analysis
- 4.5 Regulatory Landscape
- 4.6 Technological Outlook
- 4.7 Impact of Macroeconomic Factors
- 4.8 Porter's Five Forces Analysis
- 4.8.1 Threat of New Entrants
- 4.8.2 Bargaining Power of Suppliers
- 4.8.3 Bargaining Power of Buyers
- 4.8.4 Threat of Substitutes
- 4.8.5 Competitive Rivalry
5 MARKET SIZE AND GROWTH FORECASTS (VALUE)
- 5.1 By Technology
- 5.1.1 Volumetric
- 5.1.1.1 Differential Pressure
- 5.1.1.2 Electromagnetic
- 5.1.1.3 Ultrasonic
- 5.1.1.4 Turbine
- 5.1.1.5 Positive Displacement
- 5.1.1.6 Vortex
- 5.1.2 Mass
- 5.1.2.1 Coriolis
- 5.1.2.2 Thermal Mass
- 5.1.1 Volumetric
- 5.2 By Mounting/Installation
- 5.2.1 In-Line
- 5.2.2 Clamp-On/External
- 5.2.3 Insertion
- 5.3 By Fluid Type
- 5.3.1 Liquid
- 5.3.2 Gas
- 5.3.3 Steam
- 5.4 By End-User Industry
- 5.4.1 Oil and Gas
- 5.4.2 Water and Wastewater
- 5.4.3 Chemical and Petrochemical
- 5.4.4 Power Generation
- 5.4.5 Food and Beverage
- 5.4.6 Pulp and Paper
- 5.4.7 Pharmaceuticals and Biotechnology
- 5.4.8 Metals and Mining
- 5.4.9 Other End-User Industries
- 5.5 By Geography
- 5.5.1 North America
- 5.5.1.1 United States
- 5.5.1.2 Canada
- 5.5.1.3 Mexico
- 5.5.2 South America
- 5.5.2.1 Brazil
- 5.5.2.2 Argentina
- 5.5.2.3 Rest of South America
- 5.5.3 Europe
- 5.5.3.1 Germany
- 5.5.3.2 United Kingdom
- 5.5.3.3 France
- 5.5.3.4 Italy
- 5.5.3.5 Spain
- 5.5.3.6 Rest of Europe
- 5.5.4 Asia-Pacific
- 5.5.4.1 China
- 5.5.4.2 India
- 5.5.4.3 Japan
- 5.5.4.4 South Korea
- 5.5.4.5 Australia and New Zealand
- 5.5.4.6 Rest of Asia-Pacific
- 5.5.5 Middle East
- 5.5.5.1 Saudi Arabia
- 5.5.5.2 United Arab Emirates
- 5.5.5.3 Turkey
- 5.5.5.4 Rest of Middle East
- 5.5.6 Africa
- 5.5.6.1 South Africa
- 5.5.6.2 Nigeria
- 5.5.6.3 Egypt
- 5.5.6.4 Rest of Africa
- 5.5.1 North America
6 COMPETITIVE LANDSCAPE
- 6.1 Market Concentration
- 6.2 Strategic Moves
- 6.3 Market Share Analysis
- 6.4 Company Profiles (includes Global level Overview, Market level overview, Core Segments, Financials as available, Strategic Information, Market Rank/Share for key companies, Products and Services, and Recent Developments)
- 6.4.1 Azbil Corporation
- 6.4.2 Badger Meter Inc.
- 6.4.3 Bronkhorst High-Tech BV
- 6.4.4 Brooks Instrument (ITW)
- 6.4.5 Christian Burkert GmbH and Co. KG
- 6.4.6 Danfoss A/S
- 6.4.7 Dwyer Instruments LLC
- 6.4.8 Emerson Electric Co.
- 6.4.9 Endress+Hauser AG
- 6.4.10 Honeywell International Inc.
- 6.4.11 Keyence Corporation
- 6.4.12 KROHNE Messtechnik GmbH
- 6.4.13 Schneider Electric SE
- 6.4.14 Sensirion AG
- 6.4.15 Siemens AG
- 6.4.16 SICK AG
- 6.4.17 TSI Incorporated
- 6.4.18 Yokogawa Electric Corporation
- 6.4.19 ABB Ltd
7 MARKET OPPORTUNITIES AND FUTURE OUTLOOK
- 7.1 White-Space and Unmet-Need Assessment

