PUBLISHER: Mordor Intelligence | PRODUCT CODE: 2124637

PUBLISHER: Mordor Intelligence | PRODUCT CODE: 2124637
Europe Biodegradable Cups - Market Share Analysis, Industry Trends & Statistics, Growth Forecasts (2026 - 2031)
According to Mordor Intelligence, the Europe biodegradable cups market size is expected to grow from USD 260.7 million in 2025 to USD 276.89 million in 2026 and is forecast to reach USD 374.36 million by 2031 at 6.21% CAGR over 2026-2031.
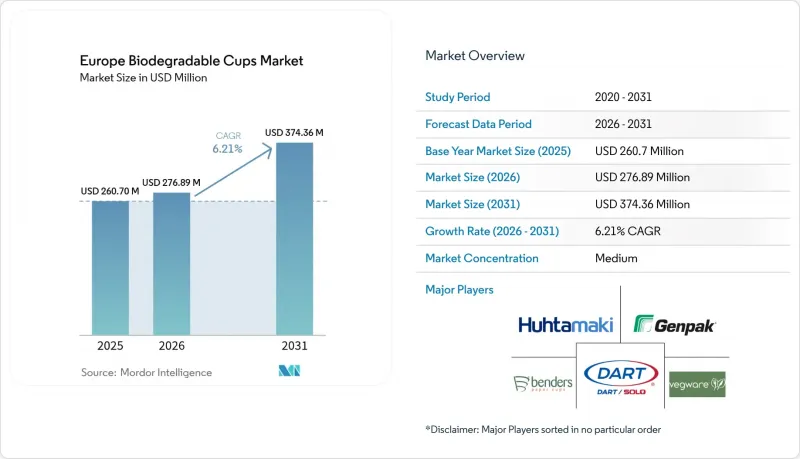
This report is Segmented by Material Type (Bio-Plastics, Paper, Bagasse and Plant Fibre), Application (Beverages, Food), End User (Food Service Outlets, Institutional, Household), Distribution Channel (Offline, and Online), and Geography (United Kingdom, Germany, France, Italy, Spain, Benelux, Rest of Europe). Market Forecasts are Provided in Terms of Value (USD).
Europe Biodegradable Cups Market Trends and Insights
Growing Demand for Sustainable Foodservice Packaging
European consumers are showing a growing intolerance for single-use plastics. A 2024 Eurobarometer survey reported that 78% now factor sustainability into venue choice. Contract caterers and quick-service chains translate sentiment into procurement policies, as evidenced by Compass Group shifting 62% of cup purchases to compostable materials across 2,000 sites. McDonald's committed in February 2025 to fiber cups with water-based coatings for every UK and Ireland outlet, eliminating polyethylene liners. EU regulations reinforce preference, mandating that all packaging be recyclable or compostable by 2030. Willingness to pay varies-Swedish patrons accept price increases of up to 12%, while operators in price-sensitive Italy and Spain demand cost parity before switching.
Stringent EU Single-Use Plastics Regulations
Member states are expected to reach full enforcement of the Single-Use Plastics Directive in 2024, closing loopholes and expanding bans. Spain prohibited the use of non-compostable cups in hospitality venues as of January 2024, with fines of up to EUR 600,000. France's AGEC law set a 2025 target for 20% reusable packaging but simultaneously banned Oxo-degradable plastics, boosting short-run demand for certified compostable cups. Italy now requires single-use cups to contain at least 40% bio-based content, essentially reserving shelf space for PLA-lined or fiber alternatives. Extended producer responsibility fees on non-recyclable cups in Germany and the Netherlands raise the relative cost of traditional plastics, accelerating the adoption of biodegradable cups in Europe.
Cost Premium Versus Conventional Paper and Plastic Cups
In Q1 2025, a 12-ounce PLA-lined cup sold for EUR 0.09-0.12, compared to EUR 0.07-0.09 for polyethylene-coated units, resulting in a 15-25% premium that margin-constrained cafes struggle to absorb. Independent operators, especially in Southern Europe, exhibit high price elasticity: 54% would postpone switching if unit costs rise more than EUR 0.03. While EPR fees reduce the penalty on certified cups in Germany and France, similar offsets remain minimal in Italy or Central Europe, tempering volume conversion in the Europe biodegradable cups market.
Other drivers and restraints analyzed in the detailed report include:
- Excess PLA Production Capacity Drives Price Cuts
- Coffee Chain Commitments to 100% Compostable Cups
- Patchy Industrial Composting Infrastructure
For complete list of drivers and restraints, kindly check the Table Of Contents.
Segment Analysis
Bio-plastics represent the fastest-growing material class, forecast to rise at 8.02% CAGR as oversupply trims PLA resin prices and spurs substitution away from polyethylene liners. PBAT blends captured an additional 18% share, thanks to their improved heat resistance for hot drinks. Emerging polyhydroxyalkanoates attract coastal operators because marine degradability eases litter liability. Paper retains the largest slice at 37.92% but expands more slowly, partly because fiber cups still underperform PLA in high-temperature service. Elevated pulp costs, with European kraft pulp averaging EUR 1,420 per ton (USD 1,562) in Q1 2025, also weigh on converter margins. Bagasse and wheat-straw substrates draw policy support under EU agricultural-waste valorization schemes, yet remain niche due to limited forming capacity. The traction of bioplastics underlines a broader pivot: as material parity improves, the Europe biodegradable cups market growth increasingly flows to resins that deliver high barrier performance without compromising compostability.
The paper's durability issues with steaming liquids and its reliance on water-based coatings constrain its long-term outlook. Nonetheless, its ubiquity in converter lines and consumer familiarity keep it the entry-level sustainable option for price-sensitive buyers. In contrast, bio-plastics now command greater attention in requests for quotation issued by institutional buyers, signaling that procurement teams value certifications and heat performance over legacy supply relationships. This mix shift ensures that bio-plastics' unit volumes will close in on paper by the end of the decade, even if the latter maintains a legacy footprint in the cold-drink service. Europe biodegradable cups market players, able to flex between fiber- and resin-lined cups, stand to secure the widest customer base.
In 2025, beverages held a dominant 70.12% share of the Europe biodegradable cups market, with projections indicating a robust 7.05% CAGR growth rate extending through 2031. Hot drinks drive most demand, yet iced beverages deliver incremental summer spikes that reward converters with agile scheduling. Beverage operators prize tight dimensional tolerances for automated lid fit, nudging them toward higher-spec PLA or dual-layer fiber cups.
The food segment, encompassing soups, noodles, and desserts, is projected to grow at a rate of approximately 6.55% CAGR, driven by the expansion of quick-service chains into hot-food-to-go menus. Larger cup formats push average selling prices higher than those of drinks, thereby cushioning converter margins. However, variable fill temperatures and oil content necessitate multilayer construction, which raises costs and limits uptake in smaller cafes. Europe biodegradable cups market share in food applications grows slowly but steadily because institutional buyers value closed-loop waste contracts that include food residues plus cup composting. As these contracts proliferate, food cups gain a firmer beachhead alongside beverages.
Complete Report Scope:
- By Material Type
- Bio-Plastics
- Polylactic Acid (PLA)
- Poly(Butylene Adipate-co-Terephthalate) (PBAT)
- Polybutylene Succinate (PBS)
- Polyhydroxyalkanoates (PHA)
- Other Bio-Plastics
- Paper
- Bagasse and Plant Fibre
- Bio-Plastics
- By Application
- Beverages
- Food
- By End User
- Food Service Outlets (Cafes and Hotels)
- Institutional (Malls and Commercial Establishments)
- Household
- By Distribution Channel
- Offline
- Online
- By Country
- United Kingdom
- Germany
- France
- Italy
- Spain
- Benelux
- Rest of Europe
List of Companies Covered in this Report:
- Huhtamaki Oyj
- Vegware Ltd.
- Dart Container Corporation
- Benders Paper Cups Ltd.
- Genpak LLC
- Pactiv LLC
- Seda International Packaging Group S.p.A.
- Stora Enso Oyj
- Eco-Products LLC
- International Paper Company
- Graphic Packaging Holding Company
- Fabri-Kal LLC
- Go-Pak Holdings Ltd.
- Bio Futura B.V.
- B-V-O International GmbH
- Scyphus Ltd.
- Colpac Ltd.
- Seda Group UK Ltd.
- World Centric Inc.
- NatureWorks LLC
Additional Benefits:
- The market estimate (ME) sheet in Excel format
- 3 months of analyst support
TABLE OF CONTENTS
1 INTRODUCTION
- 1.1 Study Assumptions and Market Definition
- 1.2 Scope of the Study
2 RESEARCH METHODOLOGY
3 EXECUTIVE SUMMARY
4 MARKET LANDSCAPE
- 4.1 Market Overview
- 4.2 Market Drivers
- 4.2.1 Growing Demand for Sustainable Foodservice Packaging
- 4.2.2 Stringent EU Single-Use Plastics Regulations
- 4.2.3 Coffee Chain Commitments to 100 % Compostable Cups
- 4.2.4 Excess PLA Production Capacity Drives Price Cuts
- 4.2.5 Retailer-Led Private-Label Eco-Packaging Race
- 4.2.6 AI-Optimised Coating Lines Reduce Scrap Rates
- 4.3 Market Restraints
- 4.3.1 Cost Premium Versus Conventional Paper and Plastic Cups
- 4.3.2 Patchy Industrial Composting Infrastructure
- 4.3.3 Rising Pulp Prices and Supply Volatility
- 4.3.4 Reusable Cup Deposit Systems Cannibalise Demand
- 4.4 Industry Value Chain Analysis
- 4.5 Regulatory Landscape
- 4.6 Technological Outlook
- 4.7 Porter's Five Forces Analysis
- 4.7.1 Bargaining Power of Suppliers
- 4.7.2 Bargaining Power of Buyers
- 4.7.3 Threat of New Entrants
- 4.7.4 Threat of Substitutes
- 4.7.5 Competitive Rivalry
- 4.8 Impact of Macroeconomic Factors on the Market
5 MARKET SIZE AND GROWTH FORECASTS (VALUE)
- 5.1 By Material Type
- 5.1.1 Bio-Plastics
- 5.1.1.1 Polylactic Acid (PLA)
- 5.1.1.2 Poly(Butylene Adipate-co-Terephthalate) (PBAT)
- 5.1.1.3 Polybutylene Succinate (PBS)
- 5.1.1.4 Polyhydroxyalkanoates (PHA)
- 5.1.1.5 Other Bio-Plastics
- 5.1.2 Paper
- 5.1.3 Bagasse and Plant Fibre
- 5.1.1 Bio-Plastics
- 5.2 By Application
- 5.2.1 Beverages
- 5.2.2 Food
- 5.3 By End User
- 5.3.1 Food Service Outlets (Cafes and Hotels)
- 5.3.2 Institutional (Malls and Commercial Establishments)
- 5.3.3 Household
- 5.4 By Distribution Channel
- 5.4.1 Offline
- 5.4.2 Online
- 5.5 By Country
- 5.5.1 United Kingdom
- 5.5.2 Germany
- 5.5.3 France
- 5.5.4 Italy
- 5.5.5 Spain
- 5.5.6 Benelux
- 5.5.7 Rest of Europe
6 COMPETITIVE LANDSCAPE
- 6.1 Market Concentration
- 6.2 Strategic Moves
- 6.3 Market Share Analysis
- 6.4 Company Profiles (includes Global Level Overview, Market Level Overview, Core Segments, Financials as available, Strategic Information, Market Rank/Share for Key Companies, Products and Services, and Recent Developments)
- 6.4.1 Huhtamaki Oyj
- 6.4.2 Vegware Ltd.
- 6.4.3 Dart Container Corporation
- 6.4.4 Benders Paper Cups Ltd.
- 6.4.5 Genpak LLC
- 6.4.6 Pactiv LLC
- 6.4.7 Seda International Packaging Group S.p.A.
- 6.4.8 Stora Enso Oyj
- 6.4.9 Eco-Products LLC
- 6.4.10 International Paper Company
- 6.4.11 Graphic Packaging Holding Company
- 6.4.12 Fabri-Kal LLC
- 6.4.13 Go-Pak Holdings Ltd.
- 6.4.14 Bio Futura B.V.
- 6.4.15 B-V-O International GmbH
- 6.4.16 Scyphus Ltd.
- 6.4.17 Colpac Ltd.
- 6.4.18 Seda Group UK Ltd.
- 6.4.19 World Centric Inc.
- 6.4.20 NatureWorks LLC
7 MARKET OPPORTUNITIES AND FUTURE OUTLOOK
- 7.1 White-Space and Unmet-Need Assessment

