PUBLISHER: Mordor Intelligence | PRODUCT CODE: 2124924

PUBLISHER: Mordor Intelligence | PRODUCT CODE: 2124924
VR Content Creation Services - Market Share Analysis, Industry Trends & Statistics, Growth Forecasts (2026 - 2031)
According to Mordor Intelligence, the VR content creation services market size is expected to grow from USD 4.53 billion in 2025 to USD 6.55 billion in 2026 and is forecast to reach USD 41.47 billion by 2031 at 44.62% CAGR over 2026-2031.
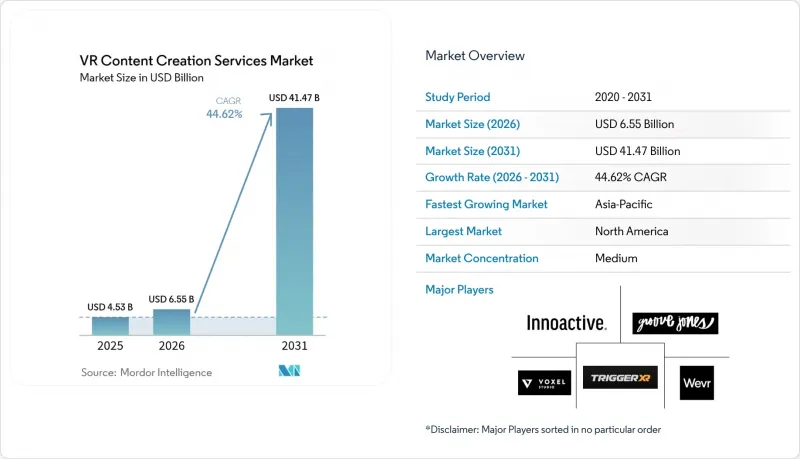
This report is Segmented by Service Type (360-Degree Photography, Post-Production Services, and More), Content Type (Entertainment, Training and Simulation, and More), End-Use Industry (Media and Entertainment, Healthcare, Education, Retail and Ecommerce, and More), Platform (PC-Based VR, Mobile VR, Console VR, Webxr), and Geography. The Market Forecasts are Provided in Terms of Value (USD).
Global VR Content Creation Services Market Trends and Insights
Proliferation of Affordable 6DoF VR Headsets
Headsets, once priced above USD 1,000, now retail for below USD 500, led by the Meta Quest 3, which shipped 2.4 million units in 2024. Apple Vision Pro carved out a premium enterprise tier at USD 3,499, encouraging studios to bid on higher-margin photorealistic projects. A larger installed base lets platform holders offer seat-based licensing, lowering the threshold for corporate training programs.
Corporate Upskilling Demand for Immersive Training Modules
It is expectecd that VR learners completed soft-skills courses more faster than classroom cohorts and reported 275% greater confidence. Walmart rolled out VR Academies to 4,700 stores, while Boeing cut 737 MAX wiring-harness training time by 75%. Quantified time savings justify multi-year content contracts that underpin the VR Content Creation Services market.
High Cost of Photorealistic Content Production Pipelines
Volumetric capture stages exceed USD 1 million in capital expenditure, and cinematic projects at firms such as Framestore often require USD 500,000 to USD 2 million per deliverable. Real-time ray-traced rendering doubles cloud costs compared with flat video, pricing small enterprises out of bespoke experiences.
Other drivers and restraints analyzed in the detailed report include:
- Integration of AI-Driven Procedural Content Generation
- Expansion of 5G Standalone Networks Enabling Mobile VR Streaming
- Fragmented Platform Standards Hindering Asset Reusability
For complete list of drivers and restraints, kindly check the Table Of Contents.
Segment Analysis
Interactive application development is projected to grow at a 46.38% CAGR, eclipsing static 3D modeling's 34.28% 2025 share. Corporations are increasingly requesting branching logic, physics-based simulations, and multi-user collaboration, thereby elevating the complexity of software engineering. Unity reported that 68% of enterprise projects now incorporate interactivity, up from 42% in 2022. AI-powered asset generators enable artists to focus on gameplay logic, reinforcing this trend.
3D modeling remains foundational, yet margin pressure rises as tools like Infinigen automate the creation of background props. 360-degree video production has evolved into a niche live-event broadcasting, while post-production services are being commoditized amid the expansion of Adobe Premiere VR toolsets. Studios with Unreal Engine expertise command premium rates, but talent shortages persist as animation veterans retrain on game-engine workflows.
Entertainment retained a 41.05% share in 2025, benefiting from the extension of blockbuster intellectual property. The VR Content Creation Services market size for healthcare visualization is forecast to expand at a 46.41% CAGR, driven by FDA Digital Health initiatives that endorse the use of VR for surgical planning. Johns Hopkins reported a 38% cut in operating-room time after VR rehearsal for complex orthopedic surgeries.
Training and simulation secure steady defense contracts, while marketing applications leverage immersive showrooms from automakers such as Audi and BMW. Architecture tours are continuing to build momentum post-pandemic, thanks to Matterport's spatial data platform. Education adoption lags due to budget constraints, but receives incremental boosts from STEM grants.
Complete Report Scope:
- By Service Type
- 3D Modeling and Animation
- Interactive Application Development
- 360-Degree Video Production
- 360-Degree Photography
- Post-Production Services
- By Content Type
- Entertainment
- Training and Simulation
- Marketing and Advertising
- Education
- Healthcare Visualization
- Architecture and Real Estate Virtual Tours
- By End-Use Industry
- Media and Entertainment
- Healthcare
- Education
- Retail and Ecommerce
- Manufacturing
- Real Estate and Construction
- Tourism and Hospitality
- By Platform
- PC-Based VR
- Mobile VR
- Console VR
- WebXR
- By Geography
- North America
- United States
- Canada
- Mexico
- Europe
- Germany
- United Kingdom
- France
- Italy
- Rest of Europe
- Asia-Pacific
- China
- Japan
- India
- South Korea
- Australia
- Rest of Asia-Pacific
- Middle East and Africa
- Middle East
- Saudi Arabia
- United Arab Emirates
- Rest of Middle East
- Africa
- South Africa
- Egypt
- Rest of Africa
- Middle East
- South America
- Brazil
- Argentina
- Rest of South America
- North America
Geography Analysis
North America generated 43.05% of global revenue in 2025, supported by Fortune 500 training budgets, Hollywood volumetric capture, and USD 1.2 billion in venture funding for immersive startups. The United States Department of Defense earmarked USD 150 million for VR training in fiscal 2024, underwriting a stable pipeline for simulation providers. Canada's CAD 25 million (USD 18.5 million) immersive-media fund fosters export-ready productions, while Mexico's automotive suppliers adopt VR for assembly training.
Asia-Pacific is forecast to post the fastest 46.33% CAGR through 2031. China aims to target CNY 250 billion (USD 35 billion) in metaverse output by 2026, offering tax rebates to content studios. South Korea's Digital New Deal set aside KRW 220 billion (USD 165 million) for immersive content, and Singapore launched a SGD 30 million (USD 22 million) grant program. Japan funds VR eldercare training under its Society 5.0 vision, while India pilots corporate upskilling programs in tech hubs.
Europe benefits from automotive and aerospace digital-twin adoption. Germany's Fraunhofer Institute collaborates with Siemens and BMW on reviewing VR prototypes. The United Kingdom now offers a 25% creative-industries tax rebate for VR production, and France invests EUR 12 million (USD 13 million) in immersive co-productions. Middle East growth is concentrated in Saudi Arabia and the United Arab Emirates, where sovereign funds are bankrolling mixed-reality tourism. South America remains in its early stages, with Brazil deploying VR showrooms despite bandwidth constraints.
- Voxel Digital Studios Inc.
- Groove Jones LLC
- Innoactive GmbH
- Wevr Inc.
- Trigger XR Inc.
- Future Visual Ltd.
- Zengalt LLC
- Subvrsive Inc.
- REWIND FX Ltd.
- Visualise Creative Ltd.
- PixelWhip Studios Pty Ltd.
- CreamVR Inc.
- B2Studio Sp. z o.o.
- VR Vision Group LLC
- Lucid Reality Labs LLC
- Metastage Inc.
- The Virtual Reality Company Inc.
- Framestore Ltd.
- Felix and Paul Studios Inc.
- Magnopus LLC
Additional Benefits:
- The market estimate (ME) sheet in Excel format
- 3 months of analyst support
TABLE OF CONTENTS
1 INTRODUCTION
- 1.1 Study Assumptions and Market Definition
- 1.2 Scope of the Study
2 RESEARCH METHODOLOGY
3 EXECUTIVE SUMMARY
4 MARKET LANDSCAPE
- 4.1 Market Overview
- 4.2 Market Drivers
- 4.2.1 Proliferation of Affordable 6DoF VR Headsets
- 4.2.2 Corporate Upskilling Demand for Immersive Training Modules
- 4.2.3 Integration of AI-Driven Procedural Content Generation
- 4.2.4 Edge-Cloud Rendering Networks Reducing Latency
- 4.2.5 Expansion of 5G Standalone Networks Enabling Mobile VR Streaming
- 4.2.6 Government Subsidies for Metaverse Ecosystems in Emerging Asian Markets
- 4.3 Market Restraints
- 4.3.1 High Cost of Photorealistic Content Production Pipelines
- 4.3.2 Fragmented Platform Standards Hindering Asset Reusability
- 4.3.3 Limited Bandwidth in Rural Regions
- 4.3.4 Intensifying Concerns over Motion Sickness and User Safety
- 4.4 Industry Value Chain Analysis
- 4.5 Regulatory Landscape
- 4.6 Technological Outlook
- 4.7 Impact of Macroeconomic Factors
- 4.8 Porter's Five Forces Analysis
- 4.8.1 Threat of New Entrants
- 4.8.2 Bargaining Power of Suppliers
- 4.8.3 Bargaining Power of Buyers
- 4.8.4 Threat of Substitutes
- 4.8.5 Competitive Rivalry
5 MARKET SIZE AND GROWTH FORECASTS (VALUE)
- 5.1 By Service Type
- 5.1.1 3D Modeling and Animation
- 5.1.2 Interactive Application Development
- 5.1.3 360-Degree Video Production
- 5.1.4 360-Degree Photography
- 5.1.5 Post-Production Services
- 5.2 By Content Type
- 5.2.1 Entertainment
- 5.2.2 Training and Simulation
- 5.2.3 Marketing and Advertising
- 5.2.4 Education
- 5.2.5 Healthcare Visualization
- 5.2.6 Architecture and Real Estate Virtual Tours
- 5.3 By End-Use Industry
- 5.3.1 Media and Entertainment
- 5.3.2 Healthcare
- 5.3.3 Education
- 5.3.4 Retail and Ecommerce
- 5.3.5 Manufacturing
- 5.3.6 Real Estate and Construction
- 5.3.7 Tourism and Hospitality
- 5.4 By Platform
- 5.4.1 PC-Based VR
- 5.4.2 Mobile VR
- 5.4.3 Console VR
- 5.4.4 WebXR
- 5.5 By Geography
- 5.5.1 North America
- 5.5.1.1 United States
- 5.5.1.2 Canada
- 5.5.1.3 Mexico
- 5.5.2 Europe
- 5.5.2.1 Germany
- 5.5.2.2 United Kingdom
- 5.5.2.3 France
- 5.5.2.4 Italy
- 5.5.2.5 Rest of Europe
- 5.5.3 Asia-Pacific
- 5.5.3.1 China
- 5.5.3.2 Japan
- 5.5.3.3 India
- 5.5.3.4 South Korea
- 5.5.3.5 Australia
- 5.5.3.6 Rest of Asia-Pacific
- 5.5.4 Middle East and Africa
- 5.5.4.1 Middle East
- 5.5.4.1.1 Saudi Arabia
- 5.5.4.1.2 United Arab Emirates
- 5.5.4.1.3 Rest of Middle East
- 5.5.4.2 Africa
- 5.5.4.2.1 South Africa
- 5.5.4.2.2 Egypt
- 5.5.4.2.3 Rest of Africa
- 5.5.4.1 Middle East
- 5.5.5 South America
- 5.5.5.1 Brazil
- 5.5.5.2 Argentina
- 5.5.5.3 Rest of South America
- 5.5.1 North America
6 COMPETITIVE LANDSCAPE
- 6.1 Market Concentration
- 6.2 Strategic Moves
- 6.3 Market Share Analysis
- 6.4 Company Profiles (includes Global Level Overview, Market Level Overview, Core Segments, Financials as available, Strategic Information, Market Rank/Share for Key Companies, Products and Services, and Recent Developments)
- 6.4.1 Voxel Digital Studios Inc.
- 6.4.2 Groove Jones LLC
- 6.4.3 Innoactive GmbH
- 6.4.4 Wevr Inc.
- 6.4.5 Trigger XR Inc.
- 6.4.6 Future Visual Ltd.
- 6.4.7 Zengalt LLC
- 6.4.8 Subvrsive Inc.
- 6.4.9 REWIND FX Ltd.
- 6.4.10 Visualise Creative Ltd.
- 6.4.11 PixelWhip Studios Pty Ltd.
- 6.4.12 CreamVR Inc.
- 6.4.13 B2Studio Sp. z o.o.
- 6.4.14 VR Vision Group LLC
- 6.4.15 Lucid Reality Labs LLC
- 6.4.16 Metastage Inc.
- 6.4.17 The Virtual Reality Company Inc.
- 6.4.18 Framestore Ltd.
- 6.4.19 Felix and Paul Studios Inc.
- 6.4.20 Magnopus LLC
7 MARKET OPPORTUNITIES AND FUTURE OUTLOOK
- 7.1 White-Space and Unmet-Need Assessment

