PUBLISHER: Mordor Intelligence | PRODUCT CODE: 2125286

PUBLISHER: Mordor Intelligence | PRODUCT CODE: 2125286
Asia-Pacific Alternating Current (AC) Drive - Market Share Analysis, Industry Trends & Statistics, Growth Forecasts (2026 - 2031)
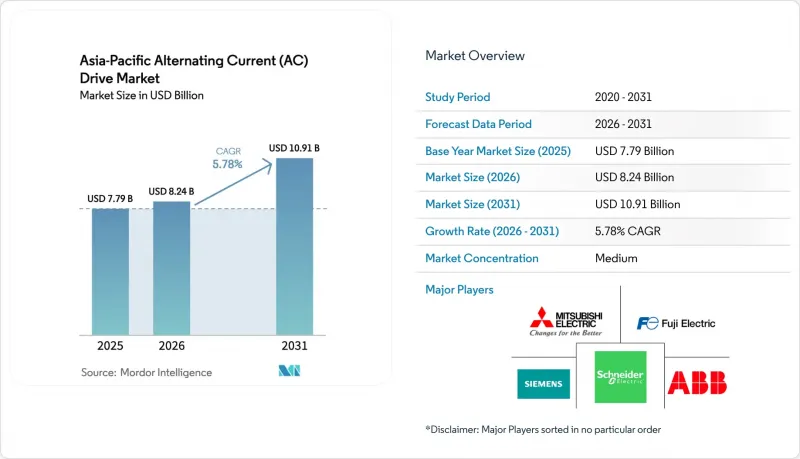
According to Mordor Intelligence, the Asia-Pacific AC drive market size in 2026 is estimated at USD 8.24 billion, growing from 2025 value of USD 7.79 billion with 2031 projections showing USD 10.91 billion, growing at 5.78% CAGR over 2026-2031.
This report is Segmented by Voltage (Low Voltage, and Medium Voltage), Power Rating (Less Than or Equal To 0. 4 KW, 0. 4-11 KW, and More), Drive Type (VSI, CSI, and PWM), Application (Pumps, Fans, Compressors, and More), End-User (Oil and Gas, Chemical, Power, Water, Metals, HVAC, Food, Manufacturing, and More), and Geography. Market Forecasts are Provided in Terms of Value (USD).
Asia-Pacific Alternating Current (AC) Drive Market Trends and Insights
Increasing Demand for Energy Savings and Efficiency
Motor systems consume nearly 45% of all electricity used in Asia-Pacific manufacturing, making them a natural target for energy efficiency measures. China's 2024 standard raised minimum efficiencies to IE3 for motors above 0.75 kW, prompting many factories to pair premium-efficiency machines with variable-speed drives. As industrial power tariffs increased by 18% between 2024 and 2025, the average drive payback period dropped below two years, accelerating retrofit programs. Singapore imposed similar IE3 mandates, reinforcing a regionwide regulatory pull. Factory managers now verify energy savings using cloud dashboards that show 20-50% reductions in pump and fan loads, solidifying drives as a core element of operational excellence.
Rapid Industrialization and Urban Development
India's USD 1.4 trillion National Infrastructure Pipeline adds airports, metros, and smart factories that require precise motor control. Production-Linked Incentive schemes worth USD 26 billion anchor new electronics and automotive plants, each specifying drives for conveyors, presses, and HVAC systems. Southeast Asia is a parallel story: Vietnam's export-oriented industrial parks adopt advanced drives from day one to ensure global quality standards. Urban building codes in Bangkok, Jakarta, and Manila now embed green-building requirements that implicitly favor variable-speed HVAC operation. Together, these projects sustain high baseline demand even if global trade softens.
High Up-Front Capital Cost for Medium-Voltage Drives
A single medium-voltage (MV) inverter can exceed USD 100,000 before site wiring, making finance teams cautious. Smaller mines and water utilities defer MV upgrades despite lifecycle savings. The ABB ACS8080, launched in November 2024, reduces its footprint by 25% and integrates safety relays to minimize ancillary costs. Even so, many buyers adopt energy-performance contracts or drive-as-a-service models that shift the burden to specialist ESCOs.
Other drivers and restraints analyzed in the detailed report include:
- Government Policies Favoring Industrial Electrification
- Declining Cost of Power Electronics Components
- Technical Skill-Gap in Drive Programming and Tuning
For complete list of drivers and restraints, kindly check the Table Of Contents.
Segment Analysis
Low-voltage drives captured 69.05% of the Asia-Pacific AC drive market share in 2025, reflecting their suitability for the vast installed base of motors with a voltage rating of less than 1 kV across manufacturing and building services. Demand for these units remains solid in 2025 because falling component prices keep initial costs within reach of small and mid-size factories. Medium-voltage products, although a smaller slice today, are expected to benefit from a 7.26% CAGR through 2031 as mining, desalination, and district cooling projects specify power ratings above 1 MW.
Industrial contractors are increasingly designing medium-voltage inverters into new facilities to avoid later retrofit expenses. Silicon-carbide switches raise efficiency to 98%, helping operators justify higher capex with sharper energy savings. Local assembly in India and Vietnam further lowers delivered costs, while integrated safety functions reduce the need for auxiliary panels. Overall, the voltage mix shows a stable core in low-voltage units and an accelerating premium tier in medium-voltage solutions.
Drives rated 0.4-11 kW accounted for 37.12% of the Asia-Pacific AC drive market size in 2025, powering pumps, fans, and conveyors that underpin light-industry operations. Standardization keeps average selling prices on a gentle downward path, widening the retrofit pool for legacy fixed-speed motors. Units above 132 kW, although fewer in number, expand at a 6.68% CAGR as petrochemical, metro, and steel projects specify high-power control to reduce energy use and improve process stability between 2026 and 2031.
High-power inverters now ship with regenerative braking and active-front-end technology as standard features, adding grid-quality benefits that align with utility regulators' expectations. Mid-range 11-132 kW models incorporate built-in cloud gateways, allowing for remote monitoring without the need for additional hardware. Below 0.4 kW, niche applications in precision tooling maintain modest yet steady volumes. This balanced spread across power classes cushions suppliers from demand swings in any single rating band.
Complete Report Scope:
- By Voltage
- Low Voltage
- Medium Voltage
- By Power Rating
- less than or equal to 0.4 kW
- 0.4 - 11 kW
- 11 - 132 kW
- Above 132 kW
- By Drive Type
- VSI Drives
- CSI Drives
- PWM Drives
- By Application
- Pumps
- Fans
- Compressors
- Conveyors
- HVAC
- Other Application
- By End-User Industry
- Oil and Gas
- Chemical and Petrochemical
- Power Generation
- Water and Wastewater
- Metals and Mining
- HVAC
- Food and Beverage
- Discrete Manufacturing
- Other End-User Industry
- By Country
- China
- India
- Japan
- South Korea
- Australia and New Zealand
- Rest of Asia Pacific
List of Companies Covered in this Report:
- ABB Ltd.
- Siemens AG
- Schneider Electric SE
- Mitsubishi Electric Corporation
- Fuji Electric Co. Ltd.
- Danfoss A/S
- Hitachi Ltd.
- Toshiba Infrastructure Systems and Solutions Corporation
- Yaskawa Electric Corporation
- Nidec Corporation
- WEG Equipamentos Eletricos S.A.
- Hiconics Eco-Energy Technology Co. Ltd.
- Teco Electric and Machinery Co. Ltd.
- Rockwell Automation Inc.
- Larsen and Toubro Limited
- Inovance Technology Co. Ltd.
- Delta Electronics Inc.
- KEB Automation KG
- CG Power and Industrial Solutions Limited
- Bonfiglioli Riduttori S.p.A.
Additional Benefits:
- The market estimate (ME) sheet in Excel format
- 3 months of analyst support
TABLE OF CONTENTS
1 INTRODUCTION
- 1.1 Study Assumptions and Market Definition
- 1.2 Scope of the Study
2 RESEARCH METHODOLOGY
3 EXECUTIVE SUMMARY
4 MARKET LANDSCAPE
- 4.1 Market Overview
- 4.2 Market Drivers
- 4.2.1 Increasing Demand for Energy Savings and Efficiency
- 4.2.2 Rapid Industrialisation and Urban Development
- 4.2.3 Government Policies Favouring Industrial Electrification
- 4.2.4 Declining Cost of Power Electronics Components
- 4.2.5 Mandatory Motor-Efficiency Standards across Asia Pacific
- 4.2.6 Surge in Renewable-Powered Pump and Fan Installations
- 4.3 Market Restraints
- 4.3.1 High Up-Front Capital Cost for Medium-Voltage Drives
- 4.3.2 Technical Skill-Gap in Drive Programming and Tuning
- 4.3.3 Supply-Chain Volatility for IGBT and Power Modules
- 4.3.4 Price Pressure from Low-Cost Regional Manufacturers
- 4.4 Industry Value Chain Analysis
- 4.5 Regulatory Landscape
- 4.6 Technological Outlook
- 4.7 Porter's Five Forces Analysis
- 4.7.1 Threat of New Entrants
- 4.7.2 Threat of Substitutes
- 4.7.3 Bargaining Power of Buyers
- 4.7.4 Bargaining Power of Suppliers
- 4.7.5 Intensity of Competitive Rivalry
- 4.8 Impact of Macroeconomic Factors
5 MARKET SIZE AND GROWTH FORECASTS (VALUE)
- 5.1 By Voltage
- 5.1.1 Low Voltage
- 5.1.2 Medium Voltage
- 5.2 By Power Rating
- 5.2.1 less than or equal to 0.4 kW
- 5.2.2 0.4 - 11 kW
- 5.2.3 11 - 132 kW
- 5.2.4 Above 132 kW
- 5.3 By Drive Type
- 5.3.1 VSI Drives
- 5.3.2 CSI Drives
- 5.3.3 PWM Drives
- 5.4 By Application
- 5.4.1 Pumps
- 5.4.2 Fans
- 5.4.3 Compressors
- 5.4.4 Conveyors
- 5.4.5 HVAC
- 5.4.6 Other Application
- 5.5 By End-User Industry
- 5.5.1 Oil and Gas
- 5.5.2 Chemical and Petrochemical
- 5.5.3 Power Generation
- 5.5.4 Water and Wastewater
- 5.5.5 Metals and Mining
- 5.5.6 HVAC
- 5.5.7 Food and Beverage
- 5.5.8 Discrete Manufacturing
- 5.5.9 Other End-User Industry
- 5.6 By Country
- 5.6.1 China
- 5.6.2 India
- 5.6.3 Japan
- 5.6.4 South Korea
- 5.6.5 Australia and New Zealand
- 5.6.6 Rest of Asia Pacific
6 COMPETITIVE LANDSCAPE
- 6.1 Market Concentration
- 6.2 Strategic Moves
- 6.3 Market Share Analysis
- 6.4 Company Profiles (includes Global Level Overview, Market Level Overview, Core Segments, Financials as available, Strategic Information, Market Rank/Share for key companies, Products and Services, and Recent Developments)
- 6.4.1 ABB Ltd.
- 6.4.2 Siemens AG
- 6.4.3 Schneider Electric SE
- 6.4.4 Mitsubishi Electric Corporation
- 6.4.5 Fuji Electric Co. Ltd.
- 6.4.6 Danfoss A/S
- 6.4.7 Hitachi Ltd.
- 6.4.8 Toshiba Infrastructure Systems and Solutions Corporation
- 6.4.9 Yaskawa Electric Corporation
- 6.4.10 Nidec Corporation
- 6.4.11 WEG Equipamentos Eletricos S.A.
- 6.4.12 Hiconics Eco-Energy Technology Co. Ltd.
- 6.4.13 Teco Electric and Machinery Co. Ltd.
- 6.4.14 Rockwell Automation Inc.
- 6.4.15 Larsen and Toubro Limited
- 6.4.16 Inovance Technology Co. Ltd.
- 6.4.17 Delta Electronics Inc.
- 6.4.18 KEB Automation KG
- 6.4.19 CG Power and Industrial Solutions Limited
- 6.4.20 Bonfiglioli Riduttori S.p.A.
7 MARKET OPPORTUNITIES AND FUTURE OUTLOOK
- 7.1 White-Space and Unmet-Need Assessment

