PUBLISHER: Mordor Intelligence | PRODUCT CODE: 2125367

PUBLISHER: Mordor Intelligence | PRODUCT CODE: 2125367
Flow Control - Market Share Analysis, Industry Trends & Statistics, Growth Forecasts (2026 - 2031)
According to Mordor Intelligence, the flow control market size is expected to grow from USD 6.21 billion in 2025 to USD 6.85 billion in 2026 and is forecast to reach USD 11.17 billion by 2031 at 10.28% CAGR over 2026-2031.
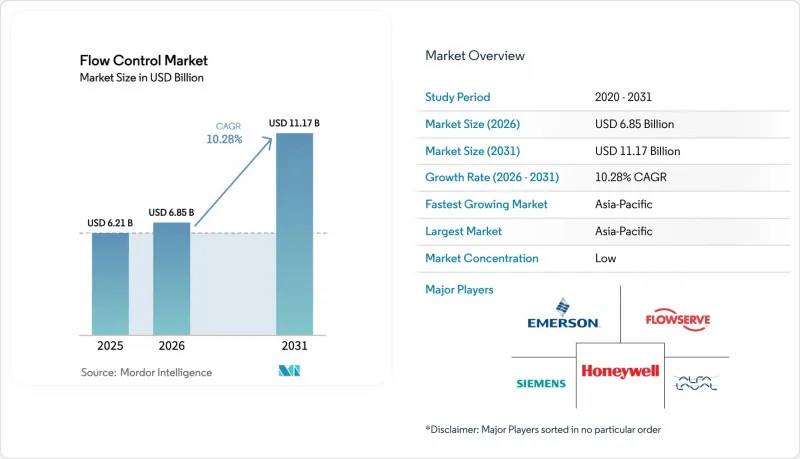
This report is Segmented by Product Type (Valves, Pumps, and More), End-User Industry (Oil and Gas, Water and Wastewater, Power Generation, and More), Function (Flow Monitoring, Flow Regulation, and More), Technology (Pneumatic, Hydraulic, and More), and Geography (North America, South America, Europe, Asia-Pacific, Middle East, Africa). The Market Forecasts are Provided in Terms of Value (USD).
Global Flow Control Market Trends and Insights
Digitization of Legacy Flow Control Infrastructure
Manufacturers are replacing pneumatic or hydraulic loops with sensor-rich electric assemblies that integrate seamlessly into plant SCADA systems. Real-time telemetry, combined with AI, reduces unscheduled downtime by as much as 30% and ensures tighter process tolerances, especially in chemical and petrochemical processes where grade yields hinge on flow accuracy. The retrofit model appeals to mature plants because it lowers capex versus full replacement, while cloud dashboards give executives immediate visibility into energy and maintenance metrics.
Surge in LNG Terminal Investments Across Emerging Economies
Vietnam, India, and Indonesia are adding greenfield terminals that require cryogenic-ready valves, actuators, and flow meters capable of operating at temperatures of>= -160 °C. Vietnam alone plans five new facilities worth USD 12 billion by 2030. Each terminal integrates redundant digital shutoff loops to meet safety integrity levels, opening premium niches for suppliers that can certify both extreme-temperature metallurgy and SIL-3 electronics.
Supply Chain Volatility for Specialty Alloys
Price swings of more than 40% in nickel-based superalloys have resulted in extended lead times of over 40 weeks for severe-service valve bodies. Engineering teams cannot readily substitute metals without requalification, and buyers often resort to dual sourcing or maintaining inventory buffers, which can increase working capital.
Other drivers and restraints analyzed in the detailed report include:
- Rapid Uptake of Modular Chemical Plants
- Sustainability Mandates Driving Water Reuse Systems
- Cybersecurity Vulnerabilities in IIoT-Enabled Devices
For complete list of drivers and restraints, kindly check the Table Of Contents.
Segment Analysis
Traditional valves held a 32.74% market share of the flow control equipment market in 2025 and are advancing at a 13.16% CAGR. Pumps and actuators remain essential for bulk fluid movement; however, their growth trails that of the intelligent valve segment, as predictive algorithms have proven to reduce maintenance outlays. Flow meters benefit from compliance-driven demand for accurate discharge reporting. Collectively, upgraded smart assemblies are expanding the installed base for diagnostics platforms, supporting aftermarket revenues that now account for more than 20% of vendor totals.
The retrofit wave favors hybrid solutions, where digital positioners are bolted onto legacy bodies, creating cost-effective pathways to analytics without halting production. Vendors with modular electronics platforms offer tailored signal protocols, including HART, Modbus, and OPC UA, which support multi-vendor architectures within brownfield plants. Suppliers also preload calibration curves that meet ISO 5167 traceability standards, thereby accelerating regulatory audits.
Oil and gas companies maintained a 28.12% market share of flow control equipment in 2025, driven by LNG expansion and methane leak reduction initiatives. Yet pharmaceuticals and biotechnology lead growth at 11.3% CAGR as cell and gene therapy lines proliferate. Water and wastewater utilities sit close behind, catalyzed by circular-economy projects. Power generators retrofit flow circuits to manage varying renewable inputs while maintaining grid inertia, which boosts demand for fast-response control valves. Chemical firms are shifting toward modular pilot plants that require reconfigurable flow skids, and hygienic food and beverage processors are buying sanitary diaphragm valves compatible with automated clean-in-place cycles.
The life-science boom hinges on validated documentation; suppliers that bundle electronic records with each skid reduce customer qualification effort. Meanwhile, conventional energy firms concentrate their spending on safety-critical units that deliver quantifiable reductions in leaks, tying equipment choices to emissions-credit strategies.
Complete Report Scope:
- By Product Type
- Valves
- Pumps
- Actuators
- Flow Meters
- By End-user Industry
- Oil and Gas
- Water and Wastewater
- Power Generation
- Chemical and Petrochemical
- Pharmaceuticals and Biotechnology
- Food and Beverage
- By Function
- Flow Monitoring
- Flow Regulation
- Flow Shutoff
- Flow Diversion
- By Technology
- Pneumatic
- Hydraulic
- Electric
- Smart/Digital
- By Geography
- North America
- United States
- Canada
- Mexico
- South America
- Brazil
- Argentina
- Rest of South America
- Europe
- Germany
- United Kingdom
- France
- Italy
- Spain
- Rest of Europe
- Asia-Pacific
- China
- Japan
- India
- Singapore
- Australia
- Malaysia
- Rest of Asia-Pacific
- Middle East and Africa
- Middle East
- Saudi Arabia
- United Arab Emirates
- Rest of Middle East
- Africa
- South Africa
- Egypt
- Rest of Africa
- Middle East
- North America
Geography Analysis
Asia Pacific's 41.55% share illustrates unmatched project volume ranging from Chinese semiconductor plants to Indian biomanufacturing parks. Government incentives, low labor costs, and rapid permitting compress asset lifecycles. Digital retrofit programs trail greenfield build-outs but are gaining traction as multinationals demand common OT standards across regions.
North American buyers allocate budgets for cyber-secure upgrades to safety-instrumented nodes, encouraged by federal critical infrastructure directives. U.S. LNG export expansion likewise sustains cryogenic valve demand. European end users earmark capex for leak-detection-and-repair equipment to meet Industrial Emissions Directive revisions, and municipal utilities have begun multi-year upgrades to achieve 2030 water reuse targets.
Gulf Cooperation Council members are integrating IIoT-based smart district cooling networks that run on looped chilled water, driving sales of corrosion-resistant butterfly valves. South American mining output boosts slurry-duty valve consumption, but macroeconomic volatility hinders capital cycles. African water-treatment build-outs are in their early stages; development banks stipulate that hardware include remote diagnostics to minimize site visits.
- Emerson Electric Co.
- Flowserve Corporation
- Siemens AG
- Honeywell International Inc.
- Alfa Laval AB
- Schlumberger Limited
- Christian Burkert GmbH & Co. KG
- Spirax-Sarco Engineering Plc
- Rotork Plc
- KSB SE & Co. KGaA
- Crane Company
- Swagelok Company
- Metso Oyj
- SAMSON AG
- IMI Plc
- Parker Hannifin Corporation
- Badger Meter Inc.
- SMC Corporation
- Festo SE & Co. KG
Additional Benefits:
- The market estimate (ME) sheet in Excel format
- 3 months of analyst support
TABLE OF CONTENTS
1 INTRODUCTION
- 1.1 Study Assumptions and Market Definition
- 1.2 Scope of the Study
2 RESEARCH METHODOLOGY
3 EXECUTIVE SUMMARY
4 MARKET LANDSCAPE
- 4.1 Market Overview
- 4.2 Market Drivers
- 4.2.1 Digitization of legacy flow control infrastructure
- 4.2.2 Surge in LNG terminal investments across emerging economies
- 4.2.3 Rapid uptake of modular chemical plants
- 4.2.4 Sustainability mandates driving water reuse systems
- 4.2.5 Tightening fugitive-emission regulations in Europe and the United States
- 4.2.6 Micro-precision flow solutions for cell and gene therapy manufacturing
- 4.3 Market Restraints
- 4.3.1 Supply chain volatility for specialty alloys
- 4.3.2 Cybersecurity vulnerabilities in IIoT-enabled devices
- 4.3.3 Capital expenditure cuts in upstream oil downstream of 2023 price shocks
- 4.3.4 Fragmented aftermarket service landscape in developing regions
- 4.4 Industry Value Chain Analysis
- 4.5 Regulatory Landscape
- 4.6 Technological Outlook
- 4.7 Porter's Five Forces Analysis
- 4.7.1 Bargaining Power of Suppliers
- 4.7.2 Bargaining Power of Buyers
- 4.7.3 Threat of New Entrants
- 4.7.4 Threat of Substitutes
- 4.7.5 Intensity of Competitive Rivalry
- 4.8 Assessment of Macro-economic Trends on the Market
5 MARKET SIZE AND GROWTH FORECASTS (VALUE)
- 5.1 By Product Type
- 5.1.1 Valves
- 5.1.2 Pumps
- 5.1.3 Actuators
- 5.1.4 Flow Meters
- 5.2 By End-user Industry
- 5.2.1 Oil and Gas
- 5.2.2 Water and Wastewater
- 5.2.3 Power Generation
- 5.2.4 Chemical and Petrochemical
- 5.2.5 Pharmaceuticals and Biotechnology
- 5.2.6 Food and Beverage
- 5.3 By Function
- 5.3.1 Flow Monitoring
- 5.3.2 Flow Regulation
- 5.3.3 Flow Shutoff
- 5.3.4 Flow Diversion
- 5.4 By Technology
- 5.4.1 Pneumatic
- 5.4.2 Hydraulic
- 5.4.3 Electric
- 5.4.4 Smart/Digital
- 5.5 By Geography
- 5.5.1 North America
- 5.5.1.1 United States
- 5.5.1.2 Canada
- 5.5.1.3 Mexico
- 5.5.2 South America
- 5.5.2.1 Brazil
- 5.5.2.2 Argentina
- 5.5.2.3 Rest of South America
- 5.5.3 Europe
- 5.5.3.1 Germany
- 5.5.3.2 United Kingdom
- 5.5.3.3 France
- 5.5.3.4 Italy
- 5.5.3.5 Spain
- 5.5.3.6 Rest of Europe
- 5.5.4 Asia-Pacific
- 5.5.4.1 China
- 5.5.4.2 Japan
- 5.5.4.3 India
- 5.5.4.4 Singapore
- 5.5.4.5 Australia
- 5.5.4.6 Malaysia
- 5.5.4.7 Rest of Asia-Pacific
- 5.5.5 Middle East and Africa
- 5.5.5.1 Middle East
- 5.5.5.1.1 Saudi Arabia
- 5.5.5.1.2 United Arab Emirates
- 5.5.5.1.3 Rest of Middle East
- 5.5.5.2 Africa
- 5.5.5.2.1 South Africa
- 5.5.5.2.2 Egypt
- 5.5.5.2.3 Rest of Africa
- 5.5.5.1 Middle East
- 5.5.1 North America
6 COMPETITIVE LANDSCAPE
- 6.1 Market Concentration
- 6.2 Strategic Moves
- 6.3 Market Share Analysis
- 6.4 Company Profiles (includes Global level Overview, Market level overview, Core Segments, Financials as available, Strategic Information, Market Rank/Share for key companies, Products and Services, and Recent Developments)
- 6.4.1 Emerson Electric Co.
- 6.4.2 Flowserve Corporation
- 6.4.3 Siemens AG
- 6.4.4 Honeywell International Inc.
- 6.4.5 Alfa Laval AB
- 6.4.6 Schlumberger Limited
- 6.4.7 Christian Burkert GmbH & Co. KG
- 6.4.8 Spirax-Sarco Engineering Plc
- 6.4.9 Rotork Plc
- 6.4.10 KSB SE & Co. KGaA
- 6.4.11 Crane Company
- 6.4.12 Swagelok Company
- 6.4.13 Metso Oyj
- 6.4.14 SAMSON AG
- 6.4.15 IMI Plc
- 6.4.16 Parker Hannifin Corporation
- 6.4.17 Badger Meter Inc.
- 6.4.18 SMC Corporation
- 6.4.19 Festo SE & Co. KG
7 MARKET OPPORTUNITIES AND FUTURE OUTLOOK
- 7.1 White-space and Unmet-Need Assessment

