PUBLISHER: Mordor Intelligence | PRODUCT CODE: 2125556

PUBLISHER: Mordor Intelligence | PRODUCT CODE: 2125556
Bus - Market Share Analysis, Industry Trends & Statistics, Growth Forecasts (2026 - 2031)
According to Mordor Intelligence, the global bus market size reached USD 109.89 billion in 2026 and is projected to expand to USD 154.78 billion by 2031, reflecting a 7.09% CAGR over the forecast period.
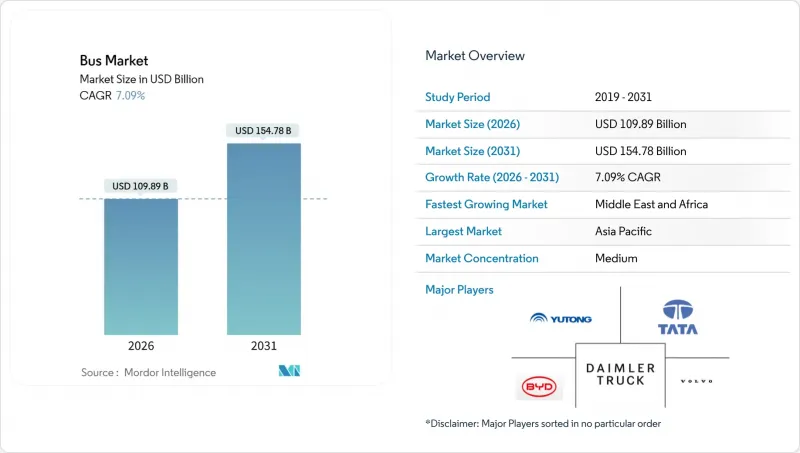
This report is Segmented by Propulsion Type (Hybrid and Electric Vehicles and Internal Combustion Engine), Deck Type (Single and Double), Application (Transit Bus, Intercity Bus/Motorcoach, School Bus, and Other Applications), Seating Capacity (Up To 30 Seats, and More), Bus Length (Up To 9m, and More), and Geography. The Market Forecasts are Provided in Terms of Value (USD) and Volume (Units).
Global Bus Market Trends and Insights
Rapid Battery-Cost Decline Enabling TCO Parity
In 2024, average pack prices declined, enabling total cost of ownership (TCO) parity with diesel fuel under favorable fuel and electricity price conditions. This parity is evident in many of the world's largest transit markets. In Santiago, the city's fleet has reported significantly lower per-kilometer costs. Additionally, reduced maintenance requirements due to fewer moving parts have significantly extended the lifespan of brake pads. While the timeline for subsidy-free viability has advanced, smaller operators still face challenges with the initial cost premium.
National ZEB Procurement Mandates
Public fleets are accelerating their replacement cycles due to mandates for zero-emission buses. California plans to prohibit diesel purchases in the coming years. Meanwhile, the European Union has set ambitious targets for zero-emission vehicles, and China is advancing rapidly toward electrifying its urban fleets . In India, the FAME-II program is driving widespread adoption of electric buses, leading to significant multi-state tenders. As a result, operators are now required to secure charging infrastructure in conjunction with their vehicle orders. This shift not only increases short-term capital demands but also provides OEMs with a clearer, long-term sales outlook.
High Upfront Price of E-Buses vs Diesel
In Brazil and South Africa, the prices of electric buses remain significantly higher due to tariff barriers and the absence of local cell production, resulting in substantial purchase premiums. These elevated costs remain a key challenge for the Bus Market, extending the payback periods and making the adoption of electric buses less financially viable for many operators. Additionally, municipal operators, often constrained by limited capital, face difficulties in meeting the higher down-payment requirements for electric buses compared to traditional diesel assets, further hindering the transition to cleaner transportation solutions.
Other drivers and restraints analyzed in the detailed report include:
- Urban Air-Quality Regulations in Mega-Cities
- Battery-as-a-Service Financing Uptake
- Slow Depot and Public Charging Roll-Out
For complete list of drivers and restraints, kindly check the Table Of Contents.
Segment Analysis
Internal-combustion platforms retained 71.23% of 2025 revenue, yet battery-electric buses are expanding at an 11.82% CAGR as ZEB mandates lock diesel out of new tenders. The battery-electric bus market is expected to experience significant growth in the coming years, becoming the most lucrative segment within the broader bus industry. Original Equipment Manufacturers (OEMs) are focusing on consolidating their cell supply chains to enhance efficiency and reduce costs. Companies like Yutong and BYD are adopting integrated production strategies to mitigate the impact of raw material price volatility. This approach provides them with a substantial cost advantage over their European competitors. As battery technology advances and real-world ranges improve, hybrids and plug-in hybrids are rapidly losing relevance. At the same time, fuel-cell buses remain a niche segment, with adoption constrained by the high costs of green hydrogen. Over the long term, diesel bus volumes are anticipated to decline, reflecting a structural shift in the market rather than a gradual diversification.
Electric-first strategies are transforming the economics of after-sales services. European manufacturers are now offering extended battery warranties, supported by advanced predictive maintenance systems that significantly reduce vehicle downtime. These systems leverage data analytics to optimize maintenance schedules and improve operational efficiency. Additionally, the adoption of Battery-as-a-Service (BaaS) contracts is transferring the risk of residual battery value from consumers to OEMs. However, this shift introduces challenges, as the lack of a mature secondary market for used batteries could pressure profit margins if not addressed in the near future.
Single-deck models accounted for 79.16% of revenue in 2025, driven by their universal fit across urban and intercity routes. Double-deck buses, however, are reviving with an 8.43% CAGR on tourism rebounds and premium express services, exemplified by London's 500-unit electric order and Hong Kong's 200 BYD deliveries. With advancements in battery technology, double-decker buses are increasingly gaining traction in the European tourist fleet market. Pantograph opportunity charging at terminals is addressing range limitations and generating interest among cities, expanding the appeal of double-deckers beyond their traditional areas of dominance.
However, technical challenges continue to hinder widespread adoption. The weight of the battery raises the vehicle's center of gravity, while height restrictions limit route options under certain bridges. Consequently, fleet planners must carefully evaluate the trade-offs between increased passenger capacity and operational flexibility, including considerations like route adaptability and depot infrastructure. These factors ensure that single-decker buses remain the cornerstone of the bus market throughout the forecast period.
Complete Report Scope:
- By Propulsion Type
- Hybrid and Electric Vehicles
- By Fuel Category
- Battery Electric Vehicle
- Fuel Cell Electric Vehicle
- Hybrid Electric Vehicle
- Plug-in Hybrid Electric Vehicle
- By Fuel Category
- Internal Combustion Engine
- By Fuel Category
- Diesel
- Others
- By Fuel Category
- Hybrid and Electric Vehicles
- By Deck Type
- Single
- Double
- By Application
- Transit Bus
- Intercity Bus / Motorcoach
- School Bus
- Other Applications
- By Seating Capacity
- Up to 30 seats
- 31 - 50 seats
- More than 50 seats
- By Bus Length
- Up to 9 m
- 9 - 12 m
- More than 12 m
- By Region
- North America
- United States
- Canada
- Rest of North America
- South America
- Brazil
- Argentina
- Rest of South America
- Europe
- Germany
- United Kingdom
- France
- Italy
- Spain
- Rest of Europe
- Asia-Pacific
- China
- India
- Japan
- South Korea
- Rest of Asia-Pacific
- Middle East and Africa
- United Arab Emirates
- Saudi Arabia
- South Africa
- Turkey
- Rest of Middle East and Africa
- North America
Geography Analysis
The Asia-Pacific region contributed 41.73% of the 2025 revenue. China leads with a significant electric fleet, while India's FAME-II scheme supports the deployment of buses in key states, including Maharashtra, Karnataka, and Delhi. Chinese OEMs offer competitively priced 12-meter electric buses due to their vertically integrated supply chains, covering everything from lithium sourcing to final assembly. In Japan and South Korea, intercity corridors are transitioning to electric, with notable contributions from domestic manufacturers. Meanwhile, ASEAN cities like Jakarta, Bangkok, and Hanoi face challenges related to grid reliability and diesel subsidies, which could delay achieving total cost of ownership (TCO) parity. As China's replacement cycle progresses, India's tender pipeline and ASEAN's development programs are expected to sustain the region's growth trajectory .
The Middle East and Africa are expected to post the highest regional CAGR at 9.73%, Saudi Arabia's Vision 2030, the UAE's rollout of electric buses, Cairo's introduction of its first BYD units, and South Africa's award of a Gautrain tender under World Bank concessional terms, all underscore the continent's electric ambitions. Funded by oil revenues, these initiatives face a hurdle: grid upgrades. To mitigate peak demand challenges, many agencies are strategically coupling bus purchases with investments in solar generation and microgrids.
Europe has made significant progress in the adoption of electric vehicles, supported by substantial grants and policy measures. Diesel phase-outs in countries such as Norway, the Netherlands, and the UK underscore a strong commitment to achieving full electrification within the decade. The Clean Vehicles Directive provides a clear framework, encouraging member states to prioritize the procurement of zero-emission buses (ZEBs), thereby fostering a stable environment for OEM investments. North America, however, is advancing at a slower pace. Despite substantial funding for clean school buses, utilities face prolonged timelines for interconnections. Additionally, recent market disruptions, such as Proterra's bankruptcy, have forced agencies to re-bid contracts, often favoring established players like NFI and Blue Bird. South America presents a mixed scenario: while cities like Santiago and Bogota operate some of the largest electric fleets outside China, economic instability in Argentina has led to tender cancellations, delaying the region's progress in scaling up electric mobility.
- Yutong Bus Co., Ltd.
- BYD Company Ltd.
- Volvo AB
- Daimler Truck Holding AG
- Tata Motors Limited
- NFI Group Inc.
- Proterra Inc.
- Anhui Ankai Automobile Co., Ltd.
- Ashok Leyland Ltd.
- King Long United Automotive
- Zhongtong Bus Holding Co., Ltd.
- Scania AB
- MAN Truck and Bus SE
- Solaris Bus and Coach Sp. z o.o.
- Alexander Dennis Ltd.
- Blue Bird Corp.
- Gillig LLC
- Marcopolo S.A.
- VDL Bus and Coach
Additional Benefits:
- The market estimate (ME) sheet in Excel format
- 3 months of analyst support
TABLE OF CONTENTS
1 Introduction
- 1.1 Study Assumptions and Market Definition
- 1.2 Scope of the Study
2 Research Methodology
3 Executive Summary
4 Key Industry Trend
- 4.1 Urbanization, Population and Vehicle/Transit Demand
- 4.2 Car Ownership and Motorization Rate
- 4.3 EV Penetration in Car Market
- 4.4 Fuel vs Electricity Price Spread (Per km, ICE vs EV)
- 4.5 EV vs ICE Total Cost of Ownership (TCO) Gap
- 4.6 Financing and Ownership Models (Loans, Leasing, Subscription)
- 4.7 Battery Chemistry Mix and Pack Energy Density
- 4.8 Home, Workplace and Public Charger Access / Density
- 4.9 Fast-Charging Network Coverage and Power Bands
- 4.10 Alternative Fuels Infrastructure (Hydrogen for FCEVs)
- 4.11 Subsidy and Consumer Incentive Value
- 4.12 OEM EV Line-up and Model Pipeline
- 4.13 Value-Chain and Distribution-Channel Analysis
- 4.14 Regulatory, Fiscal and Industrial Policy Framework
5 Market Landscape
- 5.1 Market Overview
- 5.2 Market Drivers
- 5.2.1 National ZEB procurement mandates
- 5.2.2 Rapid battery-cost decline enabling TCO parity
- 5.2.3 Urban air-quality regulations in mega-cities
- 5.2.4 OEM electrification race and model proliferation
- 5.2.5 Battery-as-a-Service financing uptake
- 5.2.6 Hydrogen corridor pilots for long-haul coaches
- 5.3 Market Restraints
- 5.3.1 High upfront price of e-buses vs diesel
- 5.3.2 Slow depot and public charging roll-out
- 5.3.3 Grid-capacity upgrades at large depots
- 5.3.4 Cathode raw-material supply volatility
- 5.4 Value / Supply-Chain Analysis
- 5.5 Regulatory Landscape
- 5.6 Technological Outlook
- 5.7 Porter's Five Forces
- 5.7.1 Threat of New Entrants
- 5.7.2 Bargaining Power of Suppliers
- 5.7.3 Bargaining Power of Buyers
- 5.7.4 Threat of Substitutes
- 5.7.5 Industry Rivalry
6 Market Size and Growth Forecasts (Value and Volume)
- 6.1 By Propulsion Type
- 6.1.1 Hybrid and Electric Vehicles
- 6.1.1.1 By Fuel Category
- 6.1.1.1.1 Battery Electric Vehicle
- 6.1.1.1.2 Fuel Cell Electric Vehicle
- 6.1.1.1.3 Hybrid Electric Vehicle
- 6.1.1.1.4 Plug-in Hybrid Electric Vehicle
- 6.1.1.1 By Fuel Category
- 6.1.2 Internal Combustion Engine
- 6.1.2.1 By Fuel Category
- 6.1.2.1.1 Diesel
- 6.1.2.1.2 Others
- 6.1.2.1 By Fuel Category
- 6.1.1 Hybrid and Electric Vehicles
- 6.2 By Deck Type
- 6.2.1 Single
- 6.2.2 Double
- 6.3 By Application
- 6.3.1 Transit Bus
- 6.3.2 Intercity Bus / Motorcoach
- 6.3.3 School Bus
- 6.3.4 Other Applications
- 6.4 By Seating Capacity
- 6.4.1 Up to 30 seats
- 6.4.2 31 - 50 seats
- 6.4.3 More than 50 seats
- 6.5 By Bus Length
- 6.5.1 Up to 9 m
- 6.5.2 9 - 12 m
- 6.5.3 More than 12 m
- 6.6 By Region
- 6.6.1 North America
- 6.6.1.1 United States
- 6.6.1.2 Canada
- 6.6.1.3 Rest of North America
- 6.6.2 South America
- 6.6.2.1 Brazil
- 6.6.2.2 Argentina
- 6.6.2.3 Rest of South America
- 6.6.3 Europe
- 6.6.3.1 Germany
- 6.6.3.2 United Kingdom
- 6.6.3.3 France
- 6.6.3.4 Italy
- 6.6.3.5 Spain
- 6.6.3.6 Rest of Europe
- 6.6.4 Asia-Pacific
- 6.6.4.1 China
- 6.6.4.2 India
- 6.6.4.3 Japan
- 6.6.4.4 South Korea
- 6.6.4.5 Rest of Asia-Pacific
- 6.6.5 Middle East and Africa
- 6.6.5.1 United Arab Emirates
- 6.6.5.2 Saudi Arabia
- 6.6.5.3 South Africa
- 6.6.5.4 Turkey
- 6.6.5.5 Rest of Middle East and Africa
- 6.6.1 North America
7 Competitive Landscape
- 7.1 Market Concentration
- 7.2 Strategic Moves
- 7.3 Market Share Analysis
- 7.4 Company Profiles (Includes Global level Overview, Market level overview, Core Segments, Financials as available, Strategic Information, Market Rank/Share, Products and Services, Recent Developments)
- 7.4.1 Yutong Bus Co., Ltd.
- 7.4.2 BYD Company Ltd.
- 7.4.3 Volvo AB
- 7.4.4 Daimler Truck Holding AG
- 7.4.5 Tata Motors Limited
- 7.4.6 NFI Group Inc.
- 7.4.7 Proterra Inc.
- 7.4.8 Anhui Ankai Automobile Co., Ltd.
- 7.4.9 Ashok Leyland Ltd.
- 7.4.10 King Long United Automotive
- 7.4.11 Zhongtong Bus Holding Co., Ltd.
- 7.4.12 Scania AB
- 7.4.13 MAN Truck and Bus SE
- 7.4.14 Solaris Bus and Coach Sp. z o.o.
- 7.4.15 Alexander Dennis Ltd.
- 7.4.16 Blue Bird Corp.
- 7.4.17 Gillig LLC
- 7.4.18 Marcopolo S.A.
- 7.4.19 VDL Bus and Coach
8 Market Opportunities and Future Outlook
- 8.1 White-space and Unmet-Need Assessment
9 Key Strategic Questions for CEOs
10 Appendix
- 10.1 Global Overview
- 10.2 Porter's Five Forces Framework
- 10.3 Global Value Chain Analysis
- 10.4 Market Dynamics (DROs)
- 10.5 Sources and References
- 10.6 List of Tables and Figures
- 10.7 Primary Insights
- 10.8 Data Pack
- 10.9 Glossary of Terms

