PUBLISHER: Mordor Intelligence | PRODUCT CODE: 2125581

PUBLISHER: Mordor Intelligence | PRODUCT CODE: 2125581
Submarine Cable Systems - Market Share Analysis, Industry Trends & Statistics, Growth Forecasts (2026 - 2031)
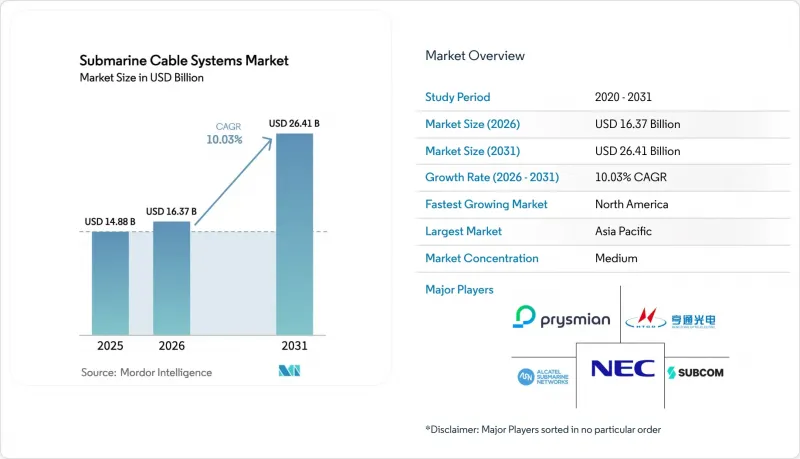
According to Mordor Intelligence, the submarine cable systems market size was valued at USD 14.88 billion in 2025 and estimated to grow from USD 16.37 billion in 2026 to reach USD 26.41 billion by 2031, at a CAGR of 10.03% during the forecast period (2026-2031).
This report Segments the Industry Into by Type (Wet-Plant Products, and Dry-Plant Products), Ownership Type (Multiple-Ownership System, Single-Ownership System, and Multilateral Development-Bank-Backed System), Application (Telecom and Internet Backbone, Offshore Wind Power Export and Array Cables, and More), Fiber-Pair Count (Less Than 8 Fiber Pairs, 9 - 16 Fiber Pairs, and More), and Geography.
Global Submarine Cable Systems Market Trends and Insights
Hyperscaler-led bandwidth demand boom
Capacity requirements for artificial-intelligence workloads and real-time cloud applications have propelled companies such as Google and Meta to self-fund trans-oceanic systems. Google's Pacific Connect program, featuring the Proa and Taihei cables, exemplifies this shift by adding multi-terabit links across the Pacific without operator consortia. Meta's Project Waterworth spans 50,000 km over five continents with 24 fiber pairs, underscoring hyperscalers' preference for control and rapid upgrade paths. These projects accelerate deployment schedules, standardize SDM architectures, and now represent almost half of all new global builds initiated since 2021.
Rapid cable construction for emerging-region connectivity
The digital-infrastructure gap in Africa and Southeast Asia is narrowing as regional operators, development banks, and cloud providers co-finance high-capacity routes. OMS Group's MIST cable exceeds 216 Tbps and links India, Malaysia, Singapore, and Thailand by 2027. West-Africa outages in 2024 exposed single-point failures, prompting governments to back redundancy corridors and pay for expedited repair services, thereby lifting long-term demand for additional wet-plant units and marine-installation vessels.
Data-sovereignty legislation complicates landing licences
Revisions to the United States Federal Communications Commission submarine-line rules now mandate three-year reporting of ownership and security practices, tightening the approval window for new landings. Parallel data-localization statutes in India and Indonesia require in-country traffic termination, forcing architectural redesigns that elevate network complexity and cost.
Other drivers and restraints analyzed in the detailed report include:
- Offshore wind-farm export-cable surge
- SDM and >=32-fiber-pair technology lowering USD /Tb costs
- Global fiber and repeater supply-chain crunch
For complete list of drivers and restraints, kindly check the Table Of Contents.
Segment Analysis
Wet-plant gear-repeaters, branching units, and SDM-ready optical amplifiers-accounted for 67.65% revenue in 2025. This sub-segment is projected to climb at a 10.62% CAGR through 2031 as operators favor ultra-long-haul routes that rely on sophisticated regeneration electronics. The submarine cable systems market size for wet-plant products translates to USD 10.07 billion in 2025 and is on track for USD 18.45 billion by the decade's close. High engineering barriers shelter incumbents, delivering stable pricing even as component costs rise.
Intelligent wet-plant offerings such as ASN's SMART cable-with integrated seafloor climate sensors-open new multi-agency funding channels. Dry-plant equipment, covering shore-end terminals and power-feed equipment, captures the balance but endures margin compression as hyperscalers design in-house landing-station hardware. Standardization by the Open Cable initiative further dilutes proprietary advantages in the dry-segment.
Consortium projects remained the largest share contributor at 54.12% in 2025, anchored by traditional carrier collaborations on trans-Atlantic links. Nevertheless, single-ownership ventures are expanding fastest at a 13.32% CAGR, underpinned by cloud-provider CAPEX strategies. The submarine cable systems market size allocated to single-owner builds is estimated at USD 6.83 billion in 2025, climbing to USD 14.46 billion by 2031, a reflection of aggressive self-build roadmaps.
Single-party control accelerates decision cycles and permits bespoke SDM designs with >32 fiber pairs, charting new capacity highs. Development-bank-backed systems, although small in volume, unlock connectivity for price-sensitive African and Pacific Island corridors where commercial returns alone are inadequate and where public-sector de-risking is essential.
Complete Report Scope:
- By Type
- Wet-Plant Products
- Dry-Plant Products
- By Ownership Type
- Consortium / Multiple-Ownership System
- Single-Ownership (Private) System
- Multilateral Development-Bank-Backed System
- By Application
- Telecom and Internet Backbone
- Offshore Wind Power Export and Array Cables
- Oil and Gas Subsea Power / Comms
- Government and Defense Surveillance
- Scientific and Research Networks
- By Fiber-Pair Count
- Less Than 8 Fiber Pairs
- 9 - 16 Fiber Pairs
- 17 - 24 Fiber Pairs
- ? 25 Fiber Pairs (SDM)
- By Geography
- North America
- United States
- Canada
- Mexico
- South America
- Brazil
- Argentina
- Rest of South America
- Europe
- United Kingdom
- Germany
- France
- Italy
- Spain
- Nordics
- Rest of Europe
- Middle East and Africa
- Middle East
- Saudi Arabia
- United Arab Emirates
- Turkey
- Rest of Middle East
- Africa
- South Africa
- Egypt
- Nigeria
- Rest of Africa
- Middle East
- Asia-Pacific
- China
- India
- Japan
- South Korea
- ASEAN
- Australia
- New Zealand
- Rest of Asia-Pacific
- North America
Geography Analysis
North America commanded 29.12% of global revenue in 2025, driven by US-centric hyperscaler activity and the early adoption of SDM architecture. Projects such as Pacific Connect and the 24-pair Bifrost system keep trans-Pacific corridors at the forefront of capacity upgrades. Domestic content rules encourage onshore manufacturing; LS Cable's Virginia site and Prysmian's Maryland investment will collectively add more than 25,000 t of annual core-conductor output by 2027.
Asia-Pacific represents the fastest-growing region with a 12.45% CAGR. China's contractors delivered over 100,000 km of wet-plant in 2024, chasing a 60% global share target by 2025. India is pivoting into a regional hub through the India-Asia Xpress, while Japan's alliances with US cloud firms bring landing diversity to Micronesia and Guam. Rising digital-economy indices across ASEAN economies guarantee multi-route demand for at least the next decade.
The twin engines of offshore-wind megaprojects and multi-gigawatt energy interconnectors buoy Europe's market. The Eastern Green Link 2 alone will lay 500 km of 525 kV cable and is expected online in 2029. Middle East and Africa benefit from strategic junction status between continents; Africa's East2West cable plan secures development-bank finance to reduce single-route exposure. South America remains small yet strategic: Google's Humboldt cable will offer the first direct South-Pacific link to Asia, reshaping Chile's connectivity map.
- Alcatel Submarine Networks SAS
- NEC Corporation
- Prysmian S.p.A. (Submarine Telecom and Power Cables BU)
- SubCom, LLC
- Hengtong Optic-Electric Co., Ltd.
- HMN Tech Co., Ltd. (Huawei Marine)
- Nexans S.A.
- Fujitsu Limited
- NTT Communications Corporation
- Google LLC
- Sumitomo Electric Industries, Ltd.
- Global Marine Systems Limited
- Orange Marine S.A.S.
- JDR Cable Systems Ltd.
- Zhongtian Technology Submarine Cable Co., Ltd.
- BW Digital Pte. Ltd. (Hawaiki)
- Padtec Holding S.A.
- Xtera, Inc.
- Orient Cable (NBO) Co., Ltd.
- Cable and Wireless Marine Service Ltd.
Additional Benefits:
- The market estimate (ME) sheet in Excel format
- 3 months of analyst support
TABLE OF CONTENTS
1 INTRODUCTION
- 1.1 Study Assumptions and Market Definition
- 1.2 Scope of the Study
2 RESEARCH METHODOLOGY
3 EXECUTIVE SUMMARY
4 MARKET LANDSCAPE
- 4.1 Market Overview
- 4.2 Market Drivers
- 4.2.1 Hyperscaler-led bandwidth demand boom
- 4.2.2 Rapid cable construction for emerging region connectivity
- 4.2.3 Offshore wind-farm export-cable surge
- 4.2.4 SDM and 32-fiber-pair technology lowering USD/Tb costs
- 4.2.5 Redeployment of retired cables for resilience in underserved islands
- 4.2.6 Green-finance incentives for low-carbon, low-loss repeaters
- 4.3 Market Restraints
- 4.3.1 Data-sovereignty legislation complicating landing licences
- 4.3.2 Geopolitical vetoes on routes and vendors
- 4.3.3 Long permitting cycles and ESG push-back on near-shore routes
- 4.3.4 Global fiber and repeater supply-chain crunch
- 4.4 Evaluation of Critical Regulatory Framework
- 4.5 Value Chain Analysis
- 4.6 Technological Outlook
- 4.7 Porter's Five Forces
- 4.7.1 Bargaining Power of Suppliers
- 4.7.2 Bargaining Power of Buyers
- 4.7.3 Threat of New Entrants
- 4.7.4 Threat of Substitutes
- 4.7.5 Competitive Rivalry
- 4.8 Impact Assessment of Key Stakeholders
- 4.9 Key Use Cases and Case Studies
- 4.10 Impact on Macroeconomic Factors of the Market
- 4.11 Investment Analysis
5 MARKET SEGMENTATION
- 5.1 By Type
- 5.1.1 Wet-Plant Products
- 5.1.2 Dry-Plant Products
- 5.2 By Ownership Type
- 5.2.1 Consortium / Multiple-Ownership System
- 5.2.2 Single-Ownership (Private) System
- 5.2.3 Multilateral Development-Bank-Backed System
- 5.3 By Application
- 5.3.1 Telecom and Internet Backbone
- 5.3.2 Offshore Wind Power Export and Array Cables
- 5.3.3 Oil and Gas Subsea Power / Comms
- 5.3.4 Government and Defense Surveillance
- 5.3.5 Scientific and Research Networks
- 5.4 By Fiber-Pair Count
- 5.4.1 Less Than 8 Fiber Pairs
- 5.4.2 9 - 16 Fiber Pairs
- 5.4.3 17 - 24 Fiber Pairs
- 5.4.4 ? 25 Fiber Pairs (SDM)
- 5.5 By Geography
- 5.5.1 North America
- 5.5.1.1 United States
- 5.5.1.2 Canada
- 5.5.1.3 Mexico
- 5.5.2 South America
- 5.5.2.1 Brazil
- 5.5.2.2 Argentina
- 5.5.2.3 Rest of South America
- 5.5.3 Europe
- 5.5.3.1 United Kingdom
- 5.5.3.2 Germany
- 5.5.3.3 France
- 5.5.3.4 Italy
- 5.5.3.5 Spain
- 5.5.3.6 Nordics
- 5.5.3.7 Rest of Europe
- 5.5.4 Middle East and Africa
- 5.5.4.1 Middle East
- 5.5.4.1.1 Saudi Arabia
- 5.5.4.1.2 United Arab Emirates
- 5.5.4.1.3 Turkey
- 5.5.4.1.4 Rest of Middle East
- 5.5.4.2 Africa
- 5.5.4.2.1 South Africa
- 5.5.4.2.2 Egypt
- 5.5.4.2.3 Nigeria
- 5.5.4.2.4 Rest of Africa
- 5.5.4.1 Middle East
- 5.5.5 Asia-Pacific
- 5.5.5.1 China
- 5.5.5.2 India
- 5.5.5.3 Japan
- 5.5.5.4 South Korea
- 5.5.5.5 ASEAN
- 5.5.5.6 Australia
- 5.5.5.7 New Zealand
- 5.5.5.8 Rest of Asia-Pacific
- 5.5.1 North America
6 COMPETITIVE LANDSCAPE
- 6.1 Market Concentration
- 6.2 Strategic Moves
- 6.3 Market Share Analysis
- 6.4 Company Profiles (includes Global level Overview, Market level overview, Core Segments, Financials as available, Strategic Information, Market Rank/Share for key companies, Products and Services, and Recent Developments)
- 6.4.1 Alcatel Submarine Networks SAS
- 6.4.2 NEC Corporation
- 6.4.3 Prysmian S.p.A. (Submarine Telecom and Power Cables BU)
- 6.4.4 SubCom, LLC
- 6.4.5 Hengtong Optic-Electric Co., Ltd.
- 6.4.6 HMN Tech Co., Ltd. (Huawei Marine)
- 6.4.7 Nexans S.A.
- 6.4.8 Fujitsu Limited
- 6.4.9 NTT Communications Corporation
- 6.4.10 Google LLC
- 6.4.11 Sumitomo Electric Industries, Ltd.
- 6.4.12 Global Marine Systems Limited
- 6.4.13 Orange Marine S.A.S.
- 6.4.14 JDR Cable Systems Ltd.
- 6.4.15 Zhongtian Technology Submarine Cable Co., Ltd.
- 6.4.16 BW Digital Pte. Ltd. (Hawaiki)
- 6.4.17 Padtec Holding S.A.
- 6.4.18 Xtera, Inc.
- 6.4.19 Orient Cable (NBO) Co., Ltd.
- 6.4.20 Cable and Wireless Marine Service Ltd.
7 MARKET OPPORTUNITIES AND FUTURE OUTLOOK
- 7.1 White-space and Unmet-need Assessment

