PUBLISHER: Mordor Intelligence | PRODUCT CODE: 2125614

PUBLISHER: Mordor Intelligence | PRODUCT CODE: 2125614
Finished Vehicles Logistics - Market Share Analysis, Industry Trends & Statistics, Growth Forecasts (2026 - 2031)
According to Mordor Intelligence, finished vehicles logistics market size in 2026 is estimated at USD 152.1 billion, growing from 2025 value of USD 146.19 billion with 2031 projections showing USD 185.35 billion, growing at 4.04% CAGR over 2026-2031.
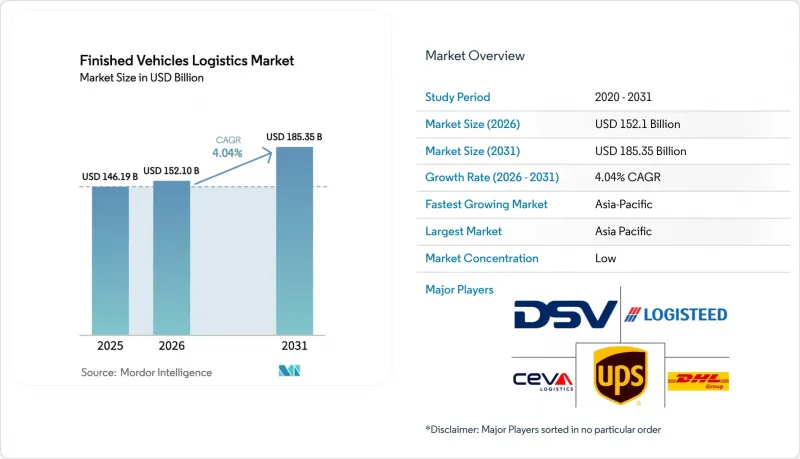
This report is Segmented by Service Type (Transportation, Warehousing & Distribution, and More), Destination (Domestic and International), Type of Vehicles (Passenger Vehicles and Commercial Vehicles), End-User Industry (OEMs, Dealers, and Others), Geography (North America, South America, Asia-Pacific, Europe, and Middle East and Africa). The Market Forecasts are Provided in Terms of Value (USD).
Global Finished Vehicles Logistics Market Trends and Insights
Growing Vehicle Sales in Emerging Markets Drive Infrastructure Expansion
Robust demand across India, Indonesia, and Vietnam is prompting the construction of new vehicle processing centers, inland depots, and last-mile networks that can serve dispersed retail outlets. Automotive production records in India are spurring port upgrades at Chennai and Mundra to handle higher Ro-Ro volumes. Logistics firms are placing regional hubs in Tier-2 cities to shorten delivery lead times and comply with in-country assembly rules. Specialized facilities now integrate pre-delivery inspection and light customization, reducing dealer inventory risk while raising throughput efficiency. Providers capable of navigating divergent customs rules and tax incentives are winning long-term contracts from OEMs looking to accelerate market entry.
OEM Push for Just-in-Sequence Distribution Transforms Service Requirements
Automakers are synchronizing vehicle drops with dealer sales velocity, replacing bulk shipments with smaller, high-frequency moves. This model relies on predictive analytics that merge plant schedules with point-of-sale data to trigger dispatch orders. Logistics partners must balance load factors against strict arrival windows, often combining road, rail, and short-sea legs in a single itinerary. Providers investing in ISO 9001-compliant control towers and real-time sensor data enjoy premium pricing as OEMs embed distribution KPIs into sourcing scorecards. The shift elevates inventory visibility from optional to mandatory, favoring operators with cloud-native platforms and automated exception handling.
Driver Shortages and High Labour Costs Constrain Operational Scaling
Industry vacancies exceed 100,000 positions in North America and Europe, pushing wage inflation to 6-8% annually and eroding margins for carriers locked into multiyear rate agreements. Specialized car-carrier drivers require extra training and certifications, lengthening onboarding timelines and raising insurance premiums. Aging workforces compound attrition, while hours-of-service limits restrict daily mileage, forcing fleets to add headcount just to maintain capacity. Automation pilots, including autonomous yard tractors and platooning on long-haul routes, remain nascent and capital-intensive, offering only gradual relief.
Other drivers and restraints analyzed in the detailed report include:
- Expansion of Chinese Vehicle Exports Reshapes Global Logistics Capacity
- Digital Freight-Visibility Platforms Enable Supply Chain Optimization
- Rising Fuel Prices and Emission Rules Increase Operational Complexity
For complete list of drivers and restraints, kindly check the Table Of Contents.
Segment Analysis
Transportation services contributed 64.85% to the Finished Vehicles Logistics market size in 2025, yet warehousing and distribution, while smaller, is projected to deliver the fastest incremental revenue at 3.84% CAGR (2026-2031). Consolidated vehicle processing centers now combine storage, customization, and charging operations, eliminating redundant handoffs and trimming dwell times. Transportation players are embedding API-enabled tracking tools that feed into OEM dashboards, creating new monetization streams from data services. Warehousing operators, in turn, deploy automated storage and retrieval cranes to stack vehicles vertically, expanding capacity without land acquisition. The convergence is blurring traditional service boundaries, leading clients to award multi-year, multi-service contracts to providers that can manage end-to-end distribution within a single SLA.
Despite transportation's dominant Finished Vehicles Logistics market share, its margin profile is under pressure from driver shortages and fluctuating diesel costs. Conversely, value-added services, although contributing the smallest top-line share, secure double-digit gross margins by bundling software updates, light accessory installation, and OEM-branded pre-delivery detailing. Providers capable of scaling these offerings across international networks are positioned to defend pricing and win renewals. Digital twins of yards and vessels enable scenario planning that optimizes loading sequences and minimizes damage, an innovation increasingly factored into tender evaluations by procurement teams.
Domestic operations accounted for 62.55% of 2025 revenue, but international volumes are accelerating as vehicle exports from China, Mexico, and Southeast Asia proliferate. Enhanced customs brokerage, multi-currency billing, and bonded storage capabilities are prerequisites for capturing this flow. Infrastructure bottlenecks, such as Ro-Ro berth constraints at Hamburg and Long Beach, heighten dwell charges and spark schedule variability. Providers that pre-book priority berths or operate dedicated feeder services mitigate these risks and command loyalty premiums.
International services also gain from the electric vehicle trade, as dedicated battery certifications and hazard-class documentation become mandatory. The Finished Vehicles Logistics market size for cross-border movements is projected to grow at a 3.52% CAGR (2026-2031). To hedge capacity risks, several Chinese OEMs are chartering vessels, squeezing space for spot shipments and prompting third-party providers to sign longer charter parties. These dynamics privilege financially robust operators able to lock in multi-year tonnage commitments.
Complete Report Scope:
- By Service Type
- Transportation
- Road
- Rail
- Air
- Sea
- Warehousing & Distribution
- Value-added Services (Assembly, Labelling, Kitting)
- Transportation
- By Destination
- Domestic
- International
- By Type of Vehicles
- Passenger Vehicles
- Commercial Vehicles
- By End-user Industry
- OEMs
- Dealers
- Others (Rental Companies, Fleet leasing companies)
- By Geography
- North America
- United States
- Canada
- Mexico
- South America
- Brazil
- Peru
- Chile
- Argentina
- Rest of South America
- Asia-Pacific
- India
- China
- Japan
- Australia
- South Korea
- South East Asia (Singapore, Malaysia, Thailand, Indonesia, Vietnam, and Philippines)
- Rest of Asia-Pacific
- Europe
- United Kingdom
- Germany
- France
- Spain
- Italy
- BENELUX (Belgium, Netherlands, and Luxembourg)
- NORDICS (Denmark, Finland, Iceland, Norway, and Sweden)
- Rest of Europe
- Middle East and Africa
- United Arab of Emirates
- Saudi Arabia
- South Africa
- Nigeria
- Rest of Middle East And Africa
- North America
Geography Analysis
Asia-Pacific retained 38.70% of the Finished Vehicles Logistics market in 2025 and leads growth at a 4.43% CAGR to 2031. Chinese OEMs such as BYD are vertically integrating ocean freight with six Ro-Ro vessels, guaranteeing lift for export programs and reducing reliance on third-party charterers. Indian output strength is pressuring inland rail corridors, prompting investment in dedicated freight corridors and expanded storage at Chennai and Kandla. Southeast Asian assembly hubs are emerging as secondary export nodes, driving feeder services into regional transshipment centers like Singapore and Tanjung Pelepas.
North America remains structurally important, supported by strong replacement demand and the near-shoring of electric vehicle production into Mexico. Cross-border traffic via Laredo and El Paso is growing faster than U.S. domestic moves, requiring specialized customs clearance and security protocols. Driver shortages remain most acute in the United States, elevating rail's modal share for long-haul vehicle moves despite autorack capacity bottlenecks. Battery-ready storage yards near California ports cater to rising EV imports while aligning with state zero-emission mandates.
Europe faces capacity pressures at key ro-ro gateways. Hamburg and Antwerp have launched multi-phase berth expansions to accommodate Asian import surges and outbound premium brands. Strict emission limits spur modal shifts to electrified rail and short-sea links, while urban micro-hubs support last-mile deliveries inside low-emission zones. Providers capable of executing cross-border rail-truck combinations gain share, especially on Central European corridors constrained by driver availability and toll increases.
- Deutsche Post DHL Group
- DSV
- CEVA Logistics
- UPS Supply Chain Solutions
- Logisteed Ltd
- CJ Logistics
- Nippon Express Co. Ltd
- Toll Group
- Yusen Logistics Co. Ltd
- Kuehne + Nagel
- Kerry Logistics Network Ltd
- Hellmann Worldwide Logistics
- Rhenus Logistics
- Geodis
- GAC
- Silk Contract Logistics
- Linc Group
- Rohlig Logistics
- Allcargo Logistics Ltd
- Broekman Logistics
Additional Benefits:
- The market estimate (ME) sheet in Excel format
- 3 months of analyst support
TABLE OF CONTENTS
1 Introduction
- 1.1 Study Assumptions & Market Definition
- 1.2 Scope of the Study
2 Research Methodology
3 Executive Summary
4 Market Landscape
- 4.1 Market Overview
- 4.2 Market Drivers
- 4.2.1 Growing vehicle sales in emerging markets
- 4.2.2 OEM push for just-in-sequence distribution
- 4.2.3 Expansion of Chinese vehicle exports
- 4.2.4 Digital freight-visibility platforms
- 4.2.5 Thermal-controlled EV battery handling
- 4.2.6 OEM micro-hub decarbonisation networks
- 4.3 Market Restraints
- 4.3.1 Driver shortages & high labour costs
- 4.3.2 Rising fuel prices & emission rules
- 4.3.3 Port congestion & Ro-Ro berth scarcity
- 4.3.4 Railcar (autorack) capacity bottlenecks
- 4.4 Value / Supply-Chain Analysis
- 4.5 Regulatory Landscape
- 4.6 Technological Outlook
- 4.7 Porter's Five Forces
- 4.7.1 Threat of New Entrants
- 4.7.2 Threat of Substitutes
- 4.7.3 Bargaining Power of Buyers
- 4.7.4 Bargaining Power of Suppliers
- 4.7.5 Intensity of Competitive Rivalry
- 4.8 Impact of Geopolitics & Pandemics
5 Market Size & Growth Forecasts
- 5.1 By Service Type
- 5.1.1 Transportation
- 5.1.1.1 Road
- 5.1.1.2 Rail
- 5.1.1.3 Air
- 5.1.1.4 Sea
- 5.1.2 Warehousing & Distribution
- 5.1.3 Value-added Services (Assembly, Labelling, Kitting)
- 5.1.1 Transportation
- 5.2 By Destination
- 5.2.1 Domestic
- 5.2.2 International
- 5.3 By Type of Vehicles
- 5.3.1 Passenger Vehicles
- 5.3.2 Commercial Vehicles
- 5.4 By End-user Industry
- 5.4.1 OEMs
- 5.4.2 Dealers
- 5.4.3 Others (Rental Companies, Fleet leasing companies)
- 5.5 By Geography
- 5.5.1 North America
- 5.5.1.1 United States
- 5.5.1.2 Canada
- 5.5.1.3 Mexico
- 5.5.2 South America
- 5.5.2.1 Brazil
- 5.5.2.2 Peru
- 5.5.2.3 Chile
- 5.5.2.4 Argentina
- 5.5.2.5 Rest of South America
- 5.5.3 Asia-Pacific
- 5.5.3.1 India
- 5.5.3.2 China
- 5.5.3.3 Japan
- 5.5.3.4 Australia
- 5.5.3.5 South Korea
- 5.5.3.6 South East Asia (Singapore, Malaysia, Thailand, Indonesia, Vietnam, and Philippines)
- 5.5.3.7 Rest of Asia-Pacific
- 5.5.4 Europe
- 5.5.4.1 United Kingdom
- 5.5.4.2 Germany
- 5.5.4.3 France
- 5.5.4.4 Spain
- 5.5.4.5 Italy
- 5.5.4.6 BENELUX (Belgium, Netherlands, and Luxembourg)
- 5.5.4.7 NORDICS (Denmark, Finland, Iceland, Norway, and Sweden)
- 5.5.4.8 Rest of Europe
- 5.5.5 Middle East and Africa
- 5.5.5.1 United Arab of Emirates
- 5.5.5.2 Saudi Arabia
- 5.5.5.3 South Africa
- 5.5.5.4 Nigeria
- 5.5.5.5 Rest of Middle East And Africa
- 5.5.1 North America
6 Competitive Landscape
- 6.1 Market Concentration Analysis
- 6.2 Strategic Moves (M&A, JVs, Automation Cap-ex)
- 6.3 Market Share Analysis
- 6.4 Company Profiles (includes Global level Overview, Market level overview, Core Segments, Financials as available, Strategic Information, Market Rank/Share for key companies, Products & Services, and Recent Developments)
- 6.4.1 Deutsche Post DHL Group
- 6.4.2 DSV
- 6.4.3 CEVA Logistics
- 6.4.4 UPS Supply Chain Solutions
- 6.4.5 Logisteed Ltd
- 6.4.6 CJ Logistics
- 6.4.7 Nippon Express Co. Ltd
- 6.4.8 Toll Group
- 6.4.9 Yusen Logistics Co. Ltd
- 6.4.10 Kuehne + Nagel
- 6.4.11 Kerry Logistics Network Ltd
- 6.4.12 Hellmann Worldwide Logistics
- 6.4.13 Rhenus Logistics
- 6.4.14 Geodis
- 6.4.15 GAC
- 6.4.16 Silk Contract Logistics
- 6.4.17 Linc Group
- 6.4.18 Rohlig Logistics
- 6.4.19 Allcargo Logistics Ltd
- 6.4.20 Broekman Logistics
7 Market Opportunities & Future Outlook
- 7.1 White-Space & Unmet-need Assessment

