PUBLISHER: Mordor Intelligence | PRODUCT CODE: 2125623

PUBLISHER: Mordor Intelligence | PRODUCT CODE: 2125623
Green Hydrogen - Market Share Analysis, Industry Trends & Statistics, Growth Forecasts (2026 - 2031)
According to Mordor Intelligence, the green hydrogen market size is projected to expand from 0.25 million tons in 2025 and 0.47 million tons in 2026 to 10.78 million tons by 2031, registering a CAGR of 87.12% between 2026 to 2031.
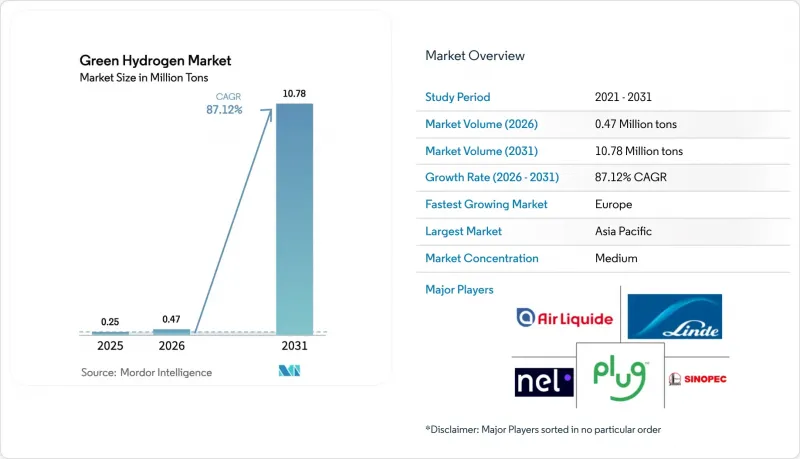
This report is Segmented by Technology (Alkaline, PEM, Solid Oxide, and AEM Electrolysis), End-User Industry (Refining, Chemicals, Iron and Steel, Transportation, and Other), and Geography (Asia-Pacific, North America, Europe, South America, and Middle-East and Africa). Market Forecasts are Provided in Terms of Volume (Tons).
Global Green Hydrogen Market Trends and Insights
Declining LCOE of Renewables in High-Irradiance Regions
In 2025, solar and onshore wind projects in Saudi Arabia, Chile, and Australia achieved low generation costs. This pricing enables electrolytic hydrogen to compete with steam methane reforming, provided natural gas prices remain favorable. The NEOM complex enjoys a competitive blended LCOE, allowing it to operate without subsidies. Meanwhile, Chile's Magallanes wind cluster aims to export green ammonia by 2030. By co-locating electrolyzers with resource sites, projects can significantly reduce transmission costs. A case in point is Fortescue's system in Pilbara, which showcases how iron-ore producers are integrating hydrogen into their operations . Collectively, these initiatives have narrowed the green premium over time.
EU Industrial Decarbonization Mandates (Steel, Fertilizer)
Under the 2026-2030 ETS, a carbon price floor renders blast-furnace steel unviable unless carbon capture or hydrogen-based DRI is employed. This is underscored by ArcelorMittal's trials in Hamburg, where a shift to hydrogen achieved a significant reduction in Scope 1 emissions. Germany allocated funds to help fertilizer producers mitigate the green premium, facilitating the offtake of green ammonia. The Carbon Border Adjustment Mechanism amplifies these challenges beyond the EU, leading Turkish and Ukrainian mills to either explore electrolytic methods or brace for tariffs on their product's value.
Iridium and Platinum Supply Bottlenecks for PEM Stacks
Global iridium output was significant in 2025, yet PEM demand may increase substantially in 2028 if loading rates stay constant. Spot iridium prices rose sharply in December 2025, adding to PEM costs. Recycling provides only a limited amount annually, and mixed-oxide substitutes lag in durability. Suppliers aim to cut loadings by 2027, but supply concentration in South Africa and labor strikes heighten price volatility.
Other drivers and restraints analyzed in the detailed report include:
- Maritime Fuel Rules Spurring Green-Ammonia Bunkering Demand
- Electrolyzer-Gigafactory Economies of Scale
- Limited Grid-Hosting Capacity for Large Electrolyzers
For complete list of drivers and restraints, kindly check the Table Of Contents.
Segment Analysis
Alkaline systems controlled 55.13% of 2025 volume, thanks to capital costs and lifetimes aligning perfectly with the demands of refiners and chemical plants operating at near-maximum efficiency. Meanwhile, PEM systems are set to climb at a 92.35% CAGR, bolstered by their rapid ramp rates, making them ideal for harnessing intermittent power. As strategies for renewable integration mature, the market size for PEM projects in the green hydrogen sector is set for a pronounced uptick. On the other hand, high-temperature SOEC pilots, boasting impressive electrical efficiency, face a hurdle: their stack life, falling short of 20,000 hours, curtails immediate adoption. AEM units, while successfully sidestepping the use of platinum group metals, grapple with a challenge of membrane durability, also under the 20,000-hour mark, before they can hit the commercial stage.
Recent orders highlight this industry shift. In 2025, refiners in the Asia-Pacific region secured a significant amount of alkaline equipment, prioritizing lower capital expenditures. Conversely, Europe, leaning towards PEM, captured a dominant share of those orders, justifying the premium with potential grid-service revenue. Solid oxide systems, though holding a smaller share of the 2025 volume, are on track for robust growth, driven by iron and steel plants merging electrolysis with their waste heat streams. This trend underscores a pivotal shift: the choice of technology is increasingly dictated by plant-specific economics rather than a blanket preference for one technology over another.
Complete Report Scope:
- By Technology
- Alkaline Electrolysis
- Proton Exchange Membrane (PEM) Electrolysis
- Solid Oxide Electrolysis
- Anion Exchange Membrane (AEM) Electrolysis
- By End-user Industry
- Refining
- Chemicals
- Iron and Steel
- Transportation
- Other End-user Industries (Power Generation, Glass, Semiconductors)
- By Geography
- Asia-Pacific
- China
- India
- Japan
- South Korea
- Rest of Asia-Pacific
- North America
- United States
- Canada
- Mexico
- Europe
- Germany
- United Kingdom
- France
- Italy
- Rest of Europe
- South America
- Brazil
- Argentina
- Rest of South America
- Middle-East and Africa
- Saudi Arabia
- South Africa
- Rest of Middle-East and Africa
- Asia-Pacific
Geography Analysis
Asia-Pacific's 48.23% share in 2025, driven by the rapid expansion of electrolyzer capacity in China and India, even as coal-dominated grids pose challenges to carbon intensity improvements. China Three Gorges operates a large electrolyzer, harnessing cost-effective off-peak wind power. With limited domestic renewable resources, Japan emerges as the top prospective importer, securing long-term agreements. South Korea, bolstered by substantial subsidies, is retrofitting the Ulsan and Incheon clusters, targeting a complete transition to green supply by 2029. Meanwhile, India's National Mission has rallied commitments, but to address reactive power and harmonic constraints in Rajasthan, an investment is needed for grid enhancements.
Europe records the highest growth rate at a projected 94.19% CAGR. The CBAM policy compels upstream suppliers to pivot to green hydrogen or incur tariffs. Concurrently, Germany is channeling significant funding into a pipeline initiative, connecting offshore wind resources to plants in the Ruhr Valley. Highlighting the region's potential, Iberdrola's ambitious project in Castilla-La Mancha demonstrates that competitively priced solar energy can yield hydrogen at a low cost. The UK is making strides too, with a long-term guarantee of a strike price, facilitating the development of new capacity. Not to be outdone, France's TotalEnergies has augmented its La Mede facility, aiming for a substantial reduction in renewable diesel emissions.
North America, buoyed by the U.S. 45V tax credit, is witnessing robust growth. Air Products is making a significant move with a large complex in Louisiana, integrating electrolysis with renewable energy, targeting substantial annual output for export. In Quebec, Canada, a plant is capitalizing on hydro energy, translating to a low production cost. Mexico is also in the fray, with Tula refinery's retrofit set to substitute gray hydrogen, leading to significant annual CO2 savings.
By 2030, the Middle East and Africa, spearheaded by NEOM and Masdar, are poised to export a large volume of green ammonia. Meanwhile, South America's Chilean wind corridor is attracting substantial investment for projects aimed at exports.
- Air Liquide
- Air Products and Chemicals Inc.
- BP PLC
- CHARBONE Hydrogen Corporation
- China Petroleum & Chemical Corporation (Sinopec)
- China Three Gorges Corporation
- Cummins Inc.
- Engie SA
- Fortescue Future Industries
- Green Hydrogen International Corp.
- Iberdrola SA
- Intercontinental Energy
- ITM Power PLC
- Lhyfe SA
- Linde PLC
- McPhy Energy S.A.
- Nel
- Ningxia Baofeng Energy Group Co. Ltd.
- Orsted A/S
- Plug Power Inc.
- Reliance Industries Limited
- Shell PLC
- Siemens Energy AG
- thyssenkrupp nucera
- Tidewater Renewables Ltd.
- Uniper SE
- Yara
Additional Benefits:
- The market estimate (ME) sheet in Excel format
- 3 months of analyst support
TABLE OF CONTENTS
1 Introduction
- 1.1 Study Assumptions and Market Definition
- 1.2 Scope of the Study
2 Research Methodology
3 Executive Summary
4 Market Landscape
- 4.1 Market Overview
- 4.2 Market Drivers
- 4.2.1 Declining LCOE of renewables in high-irradiance regions
- 4.2.2 EU industrial decarbonization mandates (steel, fertilizer)
- 4.2.3 Maritime fuel rules spurring green-ammonia bunkering demand
- 4.2.4 Electrolyzer-gigafactory economies of scale
- 4.2.5 Surplus curtailed wind/solar PPAs enabling negative-price H2
- 4.3 Market Restraints
- 4.3.1 Iridium and platinum supply bottlenecks for PEM stacks
- 4.3.2 Limited grid-hosting capacity for greater than 100 MW electrolysis clusters
- 4.3.3 High cost of cryogenic LH2 shipping over 7,000 km routes
- 4.4 Value Chain Analysis
- 4.5 Technological Outlook
- 4.6 Porter's Five Forces
- 4.6.1 Bargaining Power of Suppliers
- 4.6.2 Bargaining Power of Buyers
- 4.6.3 Threat of New Entrants
- 4.6.4 Threat of Substitute Products
- 4.6.5 Degree of Competition
5 Market Size and Growth Forecasts (Volume)
- 5.1 By Technology
- 5.1.1 Alkaline Electrolysis
- 5.1.2 Proton Exchange Membrane (PEM) Electrolysis
- 5.1.3 Solid Oxide Electrolysis
- 5.1.4 Anion Exchange Membrane (AEM) Electrolysis
- 5.2 By End-user Industry
- 5.2.1 Refining
- 5.2.2 Chemicals
- 5.2.3 Iron and Steel
- 5.2.4 Transportation
- 5.2.5 Other End-user Industries (Power Generation, Glass, Semiconductors)
- 5.3 By Geography
- 5.3.1 Asia-Pacific
- 5.3.1.1 China
- 5.3.1.2 India
- 5.3.1.3 Japan
- 5.3.1.4 South Korea
- 5.3.1.5 Rest of Asia-Pacific
- 5.3.2 North America
- 5.3.2.1 United States
- 5.3.2.2 Canada
- 5.3.2.3 Mexico
- 5.3.3 Europe
- 5.3.3.1 Germany
- 5.3.3.2 United Kingdom
- 5.3.3.3 France
- 5.3.3.4 Italy
- 5.3.3.5 Rest of Europe
- 5.3.4 South America
- 5.3.4.1 Brazil
- 5.3.4.2 Argentina
- 5.3.4.3 Rest of South America
- 5.3.5 Middle-East and Africa
- 5.3.5.1 Saudi Arabia
- 5.3.5.2 South Africa
- 5.3.5.3 Rest of Middle-East and Africa
- 5.3.1 Asia-Pacific
6 Competitive Landscape
- 6.1 Market Concentration
- 6.2 Strategic Moves
- 6.3 Market Share/Ranking Analysis
- 6.4 Company Profiles (includes Global-level Overview, Market-level Overview, Core Segments, Financials as available, Strategic Information, Products and Services, Recent Developments)
- 6.4.1 Air Liquide
- 6.4.2 Air Products and Chemicals Inc.
- 6.4.3 BP PLC
- 6.4.4 CHARBONE Hydrogen Corporation
- 6.4.5 China Petroleum & Chemical Corporation (Sinopec)
- 6.4.6 China Three Gorges Corporation
- 6.4.7 Cummins Inc.
- 6.4.8 Engie SA
- 6.4.9 Fortescue Future Industries
- 6.4.10 Green Hydrogen International Corp.
- 6.4.11 Iberdrola SA
- 6.4.12 Intercontinental Energy
- 6.4.13 ITM Power PLC
- 6.4.14 Lhyfe SA
- 6.4.15 Linde PLC
- 6.4.16 McPhy Energy S.A.
- 6.4.17 Nel
- 6.4.18 Ningxia Baofeng Energy Group Co. Ltd.
- 6.4.19 Orsted A/S
- 6.4.20 Plug Power Inc.
- 6.4.21 Reliance Industries Limited
- 6.4.22 Shell PLC
- 6.4.23 Siemens Energy AG
- 6.4.24 thyssenkrupp nucera
- 6.4.25 Tidewater Renewables Ltd.
- 6.4.26 Uniper SE
- 6.4.27 Yara
7 Market Opportunities and Future Outlook
- 7.1 White-space and Unmet-Need Assessment

