PUBLISHER: Mordor Intelligence | PRODUCT CODE: 2154444

PUBLISHER: Mordor Intelligence | PRODUCT CODE: 2154444
Retail Media Optimization Services - Market Share Analysis, Industry Trends & Statistics, Growth Forecasts (2026 - 2031)
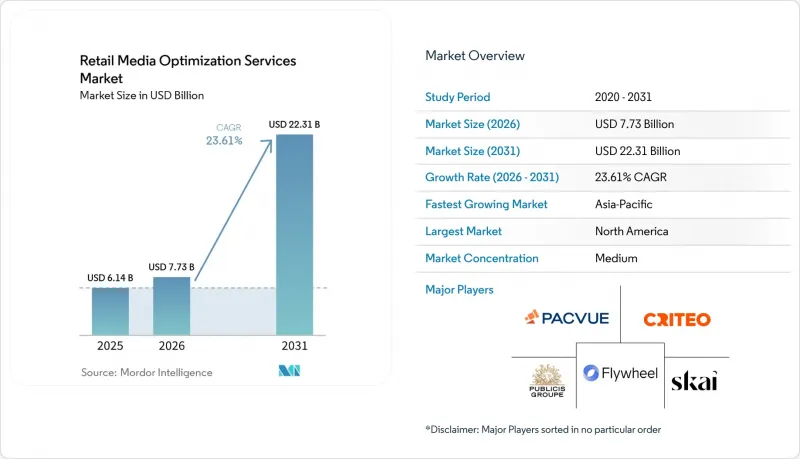
According to Mordor Intelligence, the retail media optimization services market size is projected to expand from USD 6.14 billion in 2025 and USD 7.73 billion in 2026 to USD 22.31 billion by 2031, registering a CAGR of 23.61% between 2026 to 2031.
Global Retail Media Optimization Services Market Trends and Insights
First-Party Shopper Data Monetization
Retailers hold purchase histories, loyalty records, and cart behavior that support precise audience selection. These records are becoming useful beyond traditional consumer packaged goods advertising relationships. Home Depot extended loyalty-derived first-party data to Pinterest, Reddit, Yahoo, and The Trade Desk, including use by insurance and financial services brands. This expansion creates new activation, attribution, and reporting needs for the retail media optimization services market. The IAB Tech Lab finalized PAIR 1.1 in July 2025 to support privacy-safe audience matching across participating environments. PAIR-compliant activation can broaden services from onsite campaign work to audience design, offsite delivery, and closed-loop attribution. Each additional non-endemic advertiser category can create work that retailer-owned channels did not previously support.
Rapid Retail Media Network Proliferation
The retail media optimization services market is expanding as more networks compete for brand budgets. More than 200 active retail media networks operated globally, and Germany had more than 30 active networks in 2026. Brands managed campaigns across an average of 6 networks at the time of the Skai survey. That number was projected to reach 11 by the end of 2026. Every new network brings different inventory, bidding mechanics, data fields, and reporting methods. These differences increase the integration and normalization workload facing brand teams. Mid-market and regional networks often rely on external support because in-house optimization capabilities require specialized systems and experienced staff.
Cross-Network Measurement Fragmentation
Major networks use different attribution windows, conversion definitions, and reporting methods for similar campaigns. This makes direct performance comparisons difficult without an independent normalization layer. The IAB and Media Rating Council released store retail media definitions and measurement standards in January 2025. The IAB Tech Lab followed with ADMaP 1.0 in February 2025 for attribution data matching. These standards provide a common direction, but network participation remains voluntary. Fragmented measurement limits a brand's ability to show that additional retail media spending produced incremental results. At the same time, the problem creates demand for providers that can normalize data and manage the resulting reporting burden.
Other drivers and restraints analyzed in the detailed report include:
- Omnichannel Inventory Expansion Across Onsite, Offsite, and In-Store
- AI-Driven Campaign Automation and Budget Orchestration
- Privacy and Data Access Constraints
For complete list of drivers and restraints, kindly check the Table Of Contents.
Segment Analysis
Campaign Management and Activation Services held 39.11% of the retail media optimization services market share in 2025, because brands continued to outsource campaign building, bid optimization, budget pacing, and reporting across a growing set of retailer platforms. Specialist firms maintain retail network partnerships and application programming interface integrations that many brand teams do not possess, particularly when execution must cover sponsored products, offsite inventory, and in-store formats. The leading position also reflects a structural dependence on external expertise among mid-market and regional advertisers, which often do not have enough staff to manage campaigns across several networks. Strategy and Consulting Services supports network selection, retail media maturity planning, and capability development before brands commit to larger managed-service arrangements. Creative Optimization Services benefits from the growth of onsite display, connected television, and shoppable video, where frequent variation testing is difficult to manage through manual production processes.
Training and Enablement Services is the smallest category, with demand concentrated in Asia-Pacific and parts of Europe where retail media infrastructure is newer and internal teams are still forming. Measurement and Analytics Services is projected to expand at a 24.18% CAGR through 2031, the highest rate among the service categories, as brands require incrementality testing, iROAS frameworks, and attribution models that ordinary campaign reports cannot provide. Its retail media optimization services market size is tied to a practical budget question, because credible closed-loop measurement can help marketing teams obtain approval to move trade promotion funding into retail media. Audience and Data Services includes clean room implementation, first-party segment construction, and privacy-compliant activation across onsite and offsite inventory, which are core requirements for both endemic and non-endemic advertisers. NIQ's October 2025 launch of a global data clean room on Snowflake showed how audience collaboration and performance measurement are converging around shared privacy-safe infrastructure. This convergence favors integrated platforms that can connect data, activation, and measurement, while standalone offerings become less competitive for complex enterprise engagements in the retail media optimization services industry.
Complete Report Scope:
- By Service Type
- Campaign Management and Activation Services
- Measurement and Analytics Services
- Audience and Data Services
- Strategy and Consulting Services
- Creative Optimization Services
- Training and Enablement Services
- By Geography
- North America
- United States
- Canada
- Mexico
- South America
- Brazil
- Argentina
- Chile
- Rest of South America
- Europe
- Germany
- United Kingdom
- France
- Italy
- Spain
- Russia
- Rest of Europe
- Asia-Pacific
- China
- Japan
- India
- South Korea
- Australia
- Rest of Asia-Pacific
- Middle East
- United Arab Emirates
- Saudi Arabia
- Turkey
- Rest of Middle East
- Africa
- South Africa
- Egypt
- Nigeria
- Rest of Africa
- North America
Geography Analysis
North America held 40.12% of global revenue in 2025, supported by a mature digital commerce environment and the scale of Amazon Advertising, Walmart Connect, and Target Roundel. Walmart Connect generated USD 3.4 billion in advertising revenue in 2024, according to Walmart's financial disclosures, demonstrating the commercial scale available to service providers that support large retailer networks. The region has a dense group of commerce media platforms and retail media agency practices, giving brands many choices for campaign delivery, data activation, and measurement support. This makes North America the most established part of the retail media optimization services market, where providers can apply established capabilities across a broad group of sophisticated advertiser and retailer relationships. Its retail media programs increasingly require cross-channel attribution as retailer websites, connected television, and programmatic inventory are used together. Canada and Mexico extend the regional demand base as domestic retailers establish retail media networks, creating further needs for campaign management, network integration, and repeatable operating processes.
Asia-Pacific is projected to expand at a 24.42% CAGR through 2031, the fastest regional rate in the retail media optimization services market. Japan's fragmented retailer base requires brands to optimize activity across a larger number of smaller networks than in the United States. This creates a different operating requirement for the retail media optimization services market, because providers need to support varied retailer practices rather than rely on a small number of dominant platforms. China requires services designed for livestream commerce and short-form video, which differ from display-focused onsite advertising methods. India, South Korea, and Australia add demand as e-commerce advertising infrastructure develops, making localized expertise and adaptable workflows important to regional delivery.
Europe sits between the more mature North American market and the rapidly expanding Asia-Pacific environment, with the United Kingdom ahead of France and Germany in retail media maturity. Germany had more than 30 active networks in 2026, including Rewe, Edeka, Otto, Kaufland, and Schwarz Media. Brands need specialist guidance in this fragmented setting because auction conditions, inventory options, and measurement approaches vary across networks. South America remains an emerging region where services engagement is mainly strategy and consulting-led while network infrastructure matures. The Middle East and Africa present longer-horizon opportunities, with early launches in the UAE, Saudi Arabia, South Africa, and Nigeria creating initial demand for managed campaign services and market-entry consulting.
- Criteo S.A.
- Skai (Kenshoo, Ltd.)
- Pacvue
- Flywheel Digital, Inc.
- Publicis Groupe S.A.
- Dentsu Group Inc.
- WPP plc
- Tinuiti, Inc.
- Stackline, Inc.
- Koddi, Inc.
- Epsilon Data Management, LLC
- CommerceIQ
- Merkle, Inc.
- Accenture plc
- MikMak, Inc.
- Moloco
- Channel Bakers, Inc.
- Kevel, Inc.
- Pentaleap Limited
- Topsort, Inc.
Additional Benefits:
- The market estimate (ME) sheet in Excel format
- 3 months of analyst support
TABLE OF CONTENTS
1 INTRODUCTION
- 1.1 Study Assumptions and Market Definition
- 1.2 Scope of the Study
2 RESEARCH METHODOLOGY
3 EXECUTIVE SUMMARY
4 MARKET LANDSCAPE
- 4.1 Market Overview
- 4.2 Market Drivers
- 4.2.1 First-Party Shopper Data Monetization
- 4.2.2 Rapid Retail Media Network Proliferation
- 4.2.3 Omnichannel Inventory Expansion Across Onsite, Offsite, and In-Store
- 4.2.4 AI-Driven Campaign Automation and Budget Orchestration
- 4.2.5 Incrementality and iROAS-Based Budgeting
- 4.2.6 Agentic Commerce and Feed-Ready Optimization
- 4.3 Market Restraints
- 4.3.1 Cross-Network Measurement Fragmentation
- 4.3.2 Privacy and Data Access Constraints
- 4.3.3 Analytics Talent and Workflow Gaps
- 4.3.4 Legacy MMM Under-Crediting Retail Media
- 4.4 Industry Value Chain Analysis
- 4.5 Regulatory Landscape
- 4.6 Impact of Macroeconomic Factors on the Market
- 4.7 Technological Outlook
- 4.8 Porter's Five Forces Analysis
- 4.8.1 Threat of New Entrants
- 4.8.2 Bargaining Power of Buyers
- 4.8.3 Bargaining Power of Suppliers
- 4.8.4 Threat of Substitutes
- 4.8.5 Intensity of Rivalry
5 MARKET SIZE AND GROWTH FORECASTS (VALUE)
- 5.1 By Service Type
- 5.1.1 Campaign Management and Activation Services
- 5.1.2 Measurement and Analytics Services
- 5.1.3 Audience and Data Services
- 5.1.4 Strategy and Consulting Services
- 5.1.5 Creative Optimization Services
- 5.1.6 Training and Enablement Services
- 5.2 By Geography
- 5.2.1 North America
- 5.2.1.1 United States
- 5.2.1.2 Canada
- 5.2.1.3 Mexico
- 5.2.2 South America
- 5.2.2.1 Brazil
- 5.2.2.2 Argentina
- 5.2.2.3 Chile
- 5.2.2.4 Rest of South America
- 5.2.3 Europe
- 5.2.3.1 Germany
- 5.2.3.2 United Kingdom
- 5.2.3.3 France
- 5.2.3.4 Italy
- 5.2.3.5 Spain
- 5.2.3.6 Russia
- 5.2.3.7 Rest of Europe
- 5.2.4 Asia-Pacific
- 5.2.4.1 China
- 5.2.4.2 Japan
- 5.2.4.3 India
- 5.2.4.4 South Korea
- 5.2.4.5 Australia
- 5.2.4.6 Rest of Asia-Pacific
- 5.2.5 Middle East
- 5.2.5.1 United Arab Emirates
- 5.2.5.2 Saudi Arabia
- 5.2.5.3 Turkey
- 5.2.5.4 Rest of Middle East
- 5.2.6 Africa
- 5.2.6.1 South Africa
- 5.2.6.2 Egypt
- 5.2.6.3 Nigeria
- 5.2.6.4 Rest of Africa
- 5.2.1 North America
6 COMPETITIVE LANDSCAPE
- 6.1 Market Concentration
- 6.2 Strategic Moves
- 6.3 Market Share Analysis
- 6.4 Company Profiles (includes Global Level Overview, Market Level Overview, Core Segments, Financials as available, Strategic Information, Market Rank/Share, Products and Services, Recent Developments)
- 6.4.1 Criteo S.A.
- 6.4.2 Skai (Kenshoo, Ltd.)
- 6.4.3 Pacvue
- 6.4.4 Flywheel Digital, Inc.
- 6.4.5 Publicis Groupe S.A.
- 6.4.6 Dentsu Group Inc.
- 6.4.7 WPP plc
- 6.4.8 Tinuiti, Inc.
- 6.4.9 Stackline, Inc.
- 6.4.10 Koddi, Inc.
- 6.4.11 Epsilon Data Management, LLC
- 6.4.12 CommerceIQ
- 6.4.13 Merkle, Inc.
- 6.4.14 Accenture plc
- 6.4.15 MikMak, Inc.
- 6.4.16 Moloco
- 6.4.17 Channel Bakers, Inc.
- 6.4.18 Kevel, Inc.
- 6.4.19 Pentaleap Limited
- 6.4.20 Topsort, Inc.
7 MARKET OPPORTUNITIES AND FUTURE OUTLOOK
- 7.1 White-Space and Unmet-Need Assessment

