PUBLISHER: Mordor Intelligence | PRODUCT CODE: 2154789

PUBLISHER: Mordor Intelligence | PRODUCT CODE: 2154789
North America Induction Cooktops - Market Share Analysis, Industry Trends & Statistics, Growth Forecasts (2026 - 2031)
According to Mordor Intelligence, the North American induction cooktops market size is projected to expand from USD 5.96 billion in 2025 to USD 6.22 billion in 2026, and to USD 7.98 billion by 2031, registering a CAGR of 5.11% between 2026 and 2031.
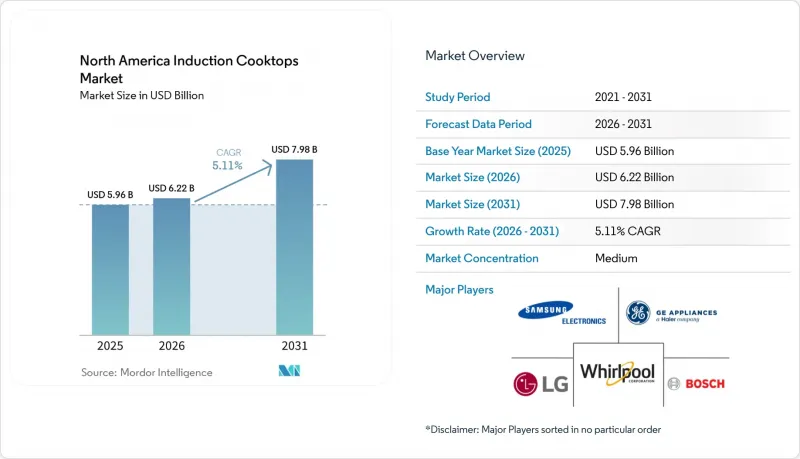
North America Induction Cooktops Market Trends and Insights
Electrification Codes, Rebates, and Gas-Connection Restrictions Are Rewriting Demand Fundamentals
Federal policy is supporting the North America induction cooktops market by reducing the cost of qualifying installations. The High-Efficiency Electric Home Rebate Act provides up to USD 840 for eligible induction cooktops or ranges, and low- to moderate-income households can receive full coverage of project costs. The requirement for permanent installation favors built-in products over portable units. California's approved Induction Cooking Market Transformation Initiative supports retail incentives, manufacturer development work for 120 V products, and utility participation. New construction gas restrictions in the United States cities and counties are also increasing the number of projects designed around electric cooking. Canada's National Energy Code for Buildings 2025 gives provinces a framework for lower-emission building requirements and can support all-electric cooking in new residential buildings.
Energy-Efficient Cooking and Lower Operating Energy Use
Energy performance remains a direct reason for households and developers to consider induction. The California technical reference database rated induction thermal efficiency at 84%, compared with 74% for electric resistance cooking and 40% for gas cooking. The United States Department of Energy states that induction transfers nearly 85% of heating energy to cookware, while gas transfers close to one-third. Faster boil times can support the consumer case for replacement, especially where energy costs and kitchen use are high. A 2025 Lawrence Berkeley National Laboratory study found no measurable rise in indoor nitrogen oxides or carbon dioxide during induction cooking, unlike gas cooking. That difference in indoor air quality can strengthen procurement interest from healthcare, elder care, and institutional kitchens.
Electrical-Service Upgrades and Peak-Load Constraints in Older Housing
Electrical capacity remains a common constraint on converting older homes from gas to induction cooking. An Electric Power Research Institute survey cited by CalMTA found that many households in the United States had limited open breaker space, especially in the western United States. The same source indicated that many existing panels in California would require a full upgrade to support the electrification of cooking. ComEd reported that customers switching from gas often required electrical work before installation, while customers already using electric cooking faced fewer electrical changes. A single-family panel upgrade can add a high upfront cost before any utility-side work. Battery-equipped 120 V induction products can reduce some panel work, but purchase prices and future battery replacement needs remain important cost factors.
Other drivers and restraints analyzed in the detailed report include:
- Premium Kitchen Remodeling and Built-In Appliance Replacement
- Smart Kitchen Connectivity and Automated Cooking Controls
- High Upfront Purchase and Installation Cost
For complete list of drivers and restraints, kindly check the Table Of Contents.
Segment Analysis
Built-in units accounted for 63.36% of the value in 2025, making them the dominant product group in the North American induction cooktops market. Their position reflects demand from renovation projects, in which fixed cooking surfaces are integrated into cabinetry and kitchen islands. Federal rebate rules for permanent installations further reinforce demand for built-in equipment. GE Appliances designed its 2025 30-inch built-in to fit existing cutouts, reducing the need for cabinet modifications when replacing units. This approach reduces a major installation concern for consumers replacing an established cooktop. Built-in products also align with the preference for coordinated, open-plan kitchen layouts.
Free-standing and portable models are forecast to grow at a 6.14% CAGR through 2031, the fastest pace within product types. The North America induction cooktops market size for this group is supported by plug-in products that can reach renters and homes where panel upgrades are difficult. A CalNEXT evaluation found that a stove with a 5-kWh battery could operate 4 induction burners at full power while limiting grid draw to 1,200 watts. Off-peak battery charging can also give utilities a tool for demand management. These models have lower average selling prices than installed units, but they make induction available to households outside the normal remodeling cycle. Their wider use can broaden the addressable customer base without requiring major kitchen construction.
3-zone configurations accounted for 41.56% of the value in 2025, reflecting their fit with standard 30-inch residential kitchen layouts. This format balances countertop space, price, and cooking flexibility for many mid-market households. The segment is well-suited to replacement installations where a standard-width cooktop is required. Buyers can use it as a practical alternative to conventional electric or gas equipment without having to move to a larger counter opening. This supports its leading position in the North America induction cooktops market. The configuration also matches the needs of households that want more capacity than portable units offer.
4-zone configurations are forecast to grow at a 6.62% CAGR through 2031, faster than other burner layouts. Buyers replacing 4-burner gas ranges may see this layout as the closest equivalent for everyday cooking. LG presented a 36-inch Full-Flex induction cooktop at KBIS 2026 with 2 extended zones for cookware up to 12.6 inches in diameter. One-zone and 2-zone products continue to serve smaller apartments, supplemental cooking needs, and budget-oriented buyers. Products with 5 zones or more remain concentrated in luxury residential kitchens and hospitality settings. The movement toward 4 zones shows that added cooking capacity is increasingly treated as a functional requirement rather than a luxury feature.
Complete Report Scope:
- By Product Type
- Built-In Induction Cooktops
- Free-Standing and Portable Induction Cooktops
- By Burner Configuration
- 1 Zone
- 2 Zones
- 3 Zones
- 4 Zones
- 5 Zones or Above
- By End-User
- Residential
- Commercial
- HoReCa (Hotels, Restaurants and Cafes/Catering)
- Institutional Kitchens
- Corporate and Office Cafeterias
- Other Commercial Applications, including Transportation, Retail and Healthcare
- By Distribution Channel
- B2B / Direct from Manufacturers
- B2C / Retail
- Multi-Brand Stores
- Exclusive Brand Outlets
- Online
- Other Distribution Channels
- By Geography
- United States
- Canada
- Mexico
List of Companies Covered in this Report:
- GE Appliances
- Whirlpool Corporation
- Samsung Electronics Co., Ltd.
- LG Electronics Inc.
- Robert Bosch GmbH
- AB Electrolux
- Midea Group
- Panasonic Holdings Corporation
- Koninklijke Philips N.V.
- Haier Smart Home Co., Ltd.
- Sub-Zero Group, Inc.
- Miele & Cie. KG
- Smeg S.p.A.
- Frigidaire
- True Induction
- Fisher & Paykel Appliances Holdings Ltd.
- KitchenAid
- Thermador
- JennAir
- Elica S.p.A.
Additional Benefits:
- The market estimate (ME) sheet in Excel format
- 3 months of analyst support
TABLE OF CONTENTS
1 Introduction
- 1.1 Study Assumptions & Market Definition
- 1.2 Scope of the Study
2 Research Methodology
3 Executive Summary
4 Market Landscape
- 4.1 Market Overview
- 4.2 Market Drivers
- 4.2.1 Premium Kitchen Remodeling and Built-In Appliance Replacement
- 4.2.2 Developer Savings from Eliminating Gas Risers and Flues
- 4.2.3 Grid-Interactive Cooking and Residential Demand Flexibility
- 4.2.4 Energy-Efficient Cooking and Lower Operating Energy Use
- 4.2.5 Electrification Codes, Rebates, and Gas-Connection Restrictions
- 4.2.6 Smart Kitchen Connectivity and Automated Cooking Controls
- 4.3 Market Restraints
- 4.3.1 Electromagnetic-Field Safety Misconceptions
- 4.3.2 Electrical-Service Upgrades and Peak-Load Constraints in Older Housing
- 4.3.3 High Upfront Purchase and Installation Cost
- 4.3.4 Ferromagnetic Cookware Compatibility and Replacement Friction
- 4.4 Industry Value Chain Analysis
- 4.5 Porter's Five Forces Analysis
- 4.5.1 Threat of New Entrants
- 4.5.2 Bargaining Power of Suppliers
- 4.5.3 Bargaining Power of Buyers
- 4.5.4 Threat of Substitutes
- 4.5.5 Industry Rivalry
- 4.6 Insights into the Latest Trends and Innovations in the Industry
- 4.7 Insights into the Recent Developments (New Product Launches, Strategic Initiatives, Investments, Partnerships, JVs, Expansion, M&As, etc.) in the Industry
5 Market Size & Growth Forecasts (Value in USD Billion)
- 5.1 By Product Type
- 5.1.1 Built-In Induction Cooktops
- 5.1.2 Free-Standing and Portable Induction Cooktops
- 5.2 By Burner Configuration
- 5.2.1 1 Zone
- 5.2.2 2 Zones
- 5.2.3 3 Zones
- 5.2.4 4 Zones
- 5.2.5 5 Zones or Above
- 5.3 By End-User
- 5.3.1 Residential
- 5.3.2 Commercial
- 5.3.2.1 HoReCa (Hotels, Restaurants and Cafes/Catering)
- 5.3.2.2 Institutional Kitchens
- 5.3.2.3 Corporate and Office Cafeterias
- 5.3.2.4 Other Commercial Applications, including Transportation, Retail and Healthcare
- 5.4 By Distribution Channel
- 5.4.1 B2B / Direct from Manufacturers
- 5.4.2 B2C / Retail
- 5.4.2.1 Multi-Brand Stores
- 5.4.2.2 Exclusive Brand Outlets
- 5.4.2.3 Online
- 5.4.2.4 Other Distribution Channels
- 5.5 By Geography
- 5.5.1 United States
- 5.5.2 Canada
- 5.5.3 Mexico
6 Competitive Landscape
- 6.1 Market Concentration
- 6.2 Strategic Moves
- 6.3 Market Share Analysis
- 6.4 Company Profiles {(includes Global level Overview, Market level overview, Core Segments, Financials as available, Strategic Information, Market Rank/Share for key companies, Products & Services, and Recent Developments)}
- 6.4.1 GE Appliances
- 6.4.2 Whirlpool Corporation
- 6.4.3 Samsung Electronics Co., Ltd.
- 6.4.4 LG Electronics Inc.
- 6.4.5 Robert Bosch GmbH
- 6.4.6 AB Electrolux
- 6.4.7 Midea Group
- 6.4.8 Panasonic Holdings Corporation
- 6.4.9 Koninklijke Philips N.V.
- 6.4.10 Haier Smart Home Co., Ltd.
- 6.4.11 Sub-Zero Group, Inc.
- 6.4.12 Miele & Cie. KG
- 6.4.13 Smeg S.p.A.
- 6.4.14 Frigidaire
- 6.4.15 True Induction
- 6.4.16 Fisher & Paykel Appliances Holdings Ltd.
- 6.4.17 KitchenAid
- 6.4.18 Thermador
- 6.4.19 JennAir
- 6.4.20 Elica S.p.A.
7 Market Opportunities & Future Outlook
- 7.1 Retail and Installer Partnership Opportunities
- 7.2 Product-Service and Connected-Appliance Revenue Pools

