PUBLISHER: Mordor Intelligence | PRODUCT CODE: 2155300

PUBLISHER: Mordor Intelligence | PRODUCT CODE: 2155300
Additive Manufacturing In-Situ Imaging - Market Share Analysis, Industry Trends & Statistics, Growth Forecasts (2026 - 2031)
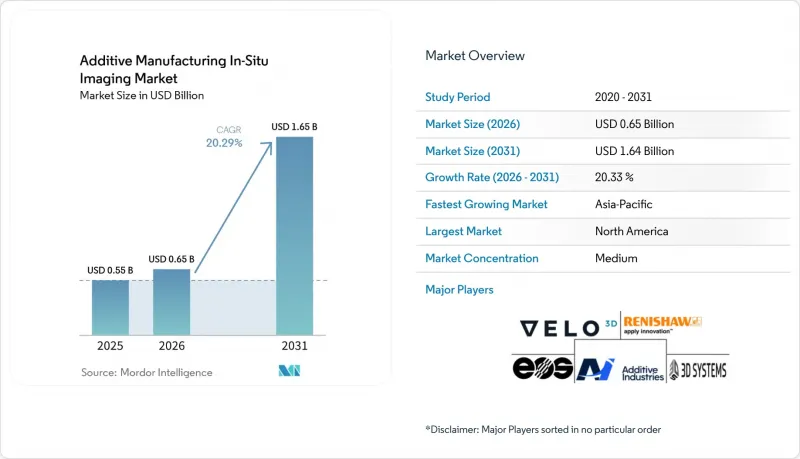
According to Mordor Intelligence, the additive manufacturing In-Situ imaging market size is expected to increase from USD 0.55 billion in 2025 to USD 0.65 billion in 2026 and reach USD 1.64 billion by 2031, growing at a CAGR of 20.33% over 2026-2031.
Global Additive Manufacturing In-Situ Imaging Market Trends and Insights
Increasing Qualification Requirements for Safety-Critical Additive Manufacturing
Qualification rules for safety-critical additive manufacturing parts are advancing faster than monitoring infrastructure. That mismatch is creating demand for systems that validate machine sensors and document production conditions. The National Institute for Aviation Research and the Air Force Research Laboratory published 2025 operational guidance for laser powder bed fusion qualification. The guidance supplements SAE AMS 7003 and AMS 7032 with machine-level sensor validation and process-monitoring documentation requirements. The U.S. Office of the Secretary of Defense directed USD 13.2 million through America Makes for the INSITE program. The program is intended to develop unified, certification-ready in-situ monitoring for defense-critical parts. Suppliers serving Lockheed Martin, GE Aerospace, and Boeing may need monitoring capabilities to preserve access to qualified supply chains. This expands purchasing beyond major original equipment manufacturers and supports adoption across smaller qualified suppliers.
Shift From Post-Process Detection to Real-Time Defect Prevention
Real-time prevention has a strong economic case for titanium, Inconel, and nickel-based superalloy parts. Rejection after post-build inspection can destroy the value created during a long and material-intensive build. ASTRO America received a USD 1.66 million award for the QTIME project in October 2025. The project is developing layer-by-layer inspection for laser powder bed fusion lattice structures. It aims to reduce the inspection time from many hours of computed tomography scanning to less than 1 hour. It also aims to reduce inspection costs by as much as 90%. Phase3D's Fringe Qualification platform supports comparison of traceable build data across machines, materials, and facilities. This can reduce repeated qualification work for each machine and part combination. NASA work shows why manufacturers seek shorter qualification cycles for metal additive manufacturing parts.
High Cost of Integrated Imaging and Edge-Computing Infrastructure
Production-grade deployment requires high-resolution cameras, thermal sensors, photodiode arrays, edge-computing equipment, and data-correlation software. This total system cost can restrict adoption among smaller contract manufacturers and research institutions. Unlike post-build computed tomography, in-situ monitoring is installed in the production environment. It cannot usually be shared among facilities through an outside inspection provider. Integration and calibration also differ across machine platforms, which limits economies of scale. ASTM International Committee F42 continues work on standards that could define common sensor interfaces and calibration protocols. Applicable standards remained in development during 2026. Until common integration practices become available, large original equipment manufacturer-linked deployments retain a cost advantage.
Other drivers and restraints analyzed in the detailed report include:
- Expansion of Serial Production in Metal Additive Manufacturing
- Integration of Artificial Intelligence With Layer-Wise Imaging Data
- Limited Standardization of Image-to-Defect Correlation Across Machines
For complete list of drivers and restraints, kindly check the Table Of Contents.
Segment Analysis
Thermal and infrared imaging held 37.51% of imaging technology revenue in 2025. This technology formed the largest part of the additive manufacturing in-situ imaging market share because it has long supported melt-pool monitoring. It is used most often in laser powder bed fusion and directed energy deposition systems. Infrared cameras can fit within existing build chambers with limited changes to optical access. Their output is also closely tied to the heat behavior of laser-material interaction. Operators can use that thermal information as a familiar process-control reference. Visible-light imaging represented the second-largest technology group. It captures powder-bed surface conditions layer by layer. Manufacturers increasingly combine visible and thermal sensors in multimodal systems. This combination can improve the location of suspected defects.
The U.S. Department of Energy Manufacturing Demonstration Facility evaluated a visible and near-infrared camera configuration on an EOS M290 system. The evaluation connected in-situ signatures with porosity detected by computed tomography. Optical tomography and coherence imaging remain smaller commercial areas. They are relevant when users need to assess subsurface layer quality without relying only on post-build computed tomography. A 2026 study demonstrated optical coherence tomography integrated with fused deposition modeling print heads. The work enabled volumetric layer scanning during production. X-ray and other advanced imaging is forecast to expand at a 24.21% CAGR through 2031. The additive manufacturing in-situ imaging market size for this technology is supported by interest in production-relevant validation. Research described deep-learning reconstruction that produced volumetric images from 10 times fewer X-ray projections. This work supports the possibility of near-real-time computed tomography assessment during laser powder bed fusion builds.
Powder bed fusion held 60.33% of process revenue in 2025. It led the additive manufacturing in-situ imaging market share because its enclosed chamber supports fixed imaging positions across the build plate. This design can reduce training complexity for monitoring algorithms. The laser powder bed fusion installed base is also the largest within metal additive manufacturing. That installed base makes the process a practical starting point for monitoring deployments. The 2025 ASTRO America and ASTM challenge focused on commercially viable monitoring for GE Concept M2 Series 5 laser powder bed fusion systems. Lockheed Martin and GE Aerospace procurement teams participated in an end-user evaluation. Binder jetting, material extrusion, and vat photopolymerization remain smaller monitoring applications. Vat photopolymerization has relevance for biomedical resin printing, where layer validation supports patient-matched devices.
Directed energy deposition is forecast to expand at a 23.26% CAGR through 2031. Its adoption for repair, multi-material deposition, and large aerospace structures creates a need for more capable monitoring. The moving deposition head changes the imaging reference frame during production. This makes fixed-camera monitoring more difficult than it is for powder bed fusion. A 2025 study described co-axial optical monitoring synchronized with wire directed energy deposition tool-center-point paths. It combined this approach with process-specific deep learning models at production-relevant speeds. A 2026 study tested monitoring and control for wire-fed directed energy deposition using infrared thermography and computer vision. The approach predicted and corrected heat accumulation during production. This addresses the microstructural variation that has limited wider use of the process for structural parts.
Complete Report Scope:
- By Imaging Technology
- Visible-Light Imaging
- Thermal and Infrared Imaging
- Optical Tomography and Coherence Imaging
- X-Ray and Other Advanced Imaging
- By Additive Manufacturing Process
- Powder Bed Fusion
- Directed Energy Deposition
- Binder Jetting
- Material Extrusion
- Vat Photopolymerization
- Other Additive Manufacturing Processes
- By Offering
- Imaging and Sensor Hardware
- Data Acquisition and Edge-Computing Hardware
- Monitoring Software and Analytics
- Integration, Calibration, Validation, and Support Services
- By End-User
- Aerospace and Defense
- Medical Devices and Implants
- Energy and Power Generation
- Industrial Machinery and Heavy Engineering
- Automotive and Transportation
- Research Institutions and Universities
- Other End-Users
- By Geography
- North America
- United States
- Canada
- Mexico
- South America
- Brazil
- Argentina
- Rest of South America
- Europe
- Germany
- United Kingdom
- France
- Italy
- Spain
- Rest of Europe
- Asia-Pacific
- China
- Japan
- India
- South Korea
- ASEAN
- Rest of Asia-Pacific
- Middle East
- Saudi Arabia
- United Arab Emirates
- Turkey
- Rest of the Middle East
- Africa
- South Africa
- Nigeria
- Rest of Africa
- North America
Geography Analysis
North America held 38.43% of global revenue in 2025. The region led the additive manufacturing in-situ imaging market share through its concentration of aerospace and defense manufacturers. America Makes, NASA, AFRL, OSD ManTech, and the Department of Energy Manufacturing Demonstration Facility provide institutional support. The USD 13.2 million INSITE program and the USD 1.66 million QTIME award are directed toward commercially deployable monitoring tools. Canada adds demand through aerospace component supply chains. Mexico's manufacturing corridor can extend monitoring requirements to suppliers that receive near-shoring investment. The United States remains the most important country for global market formation as a buyer and funder of commercialization programs.
Asia-Pacific is forecast to expand at a 24.41% CAGR through 2031. China is the principal regional driver because of its state-supported additive manufacturing plans and aerospace production activity. The input reported China's additive manufacturing output rising to CNY 70 billion (USD 9.7 billion) during the 14th Five-Year Plan period. It reported a 2030 target of CNY 147.9 billion (USD 20.5 billion) to CNY 150 billion (USD 20.8 billion). The January 2026 certification of 23 titanium alloy structural components for the C919 aircraft supports demand for machine-readable quality records. Japan is deepening metal additive manufacturing use in automotive and precision-machinery supply chains. South Korea adds demand through additive manufacturing for tooling and functional components in its semiconductor and consumer electronics ecosystem.
Europe retains a meaningful position in the additive manufacturing in-situ imaging market through German machinery and aerospace production. The United Kingdom has defense and medical device manufacturing capabilities. France and Italy contribute through Airbus supply chains. Renishaw expanded its InfiniAM monitoring offering through InfiniAM Spectral and InfiniAM Camera modules for RenAM 500 machines. Its integrations with Addiguru and Apex Additive Technologies reflect production-oriented monitoring deployment. Regional digital-manufacturing policies support closed-loop quality systems and machine-readable build records. Saudi Arabia and the United Arab Emirates represent early demand centers in the Middle East. South America and Africa remain early-stage markets, with activity concentrated in research institutions and Brazil's aerospace cluster.
- EOS GmbH
- Renishaw plc
- Nikon SLM Solutions AG
- Additive Industries B.V.
- Velo3D, Inc.
- 3D Systems Corporation
- Stratasys Ltd.
- TRUMPF SE + Co. KG
- SLM Solutions Group AG
- Farsoon Technologies Co., Ltd.
- Aconity3D GmbH
- Freemelt AB
- Meltio S.L.
- Lithoz GmbH
- Formlabs, Inc.
- BigRep GmbH
- Markforged Holding Corporation
- Xact Metal, Inc.
- Additive Industries North America Inc.
- Desktop Metal, Inc.
- Additive Assurance Pty Ltd
- Phase3D, Inc.
- Addiguru, Inc.
- Interspectral AB
- Euler 3D, Inc.
- NexusAM Ltd
Additional Benefits:
- The market estimate (ME) sheet in Excel format
- 3 months of analyst support
TABLE OF CONTENTS
1 INTRODUCTION
- 1.1 Study Assumptions and Market Definition
- 1.2 Scope of the Study
2 RESEARCH METHODOLOGY
3 EXECUTIVE SUMMARY
4 MARKET LANDSCAPE
- 4.1 Market Overview
- 4.2 Market Drivers
- 4.2.1 Increasing Qualification Requirements for Safety-Critical Additive Manufacturing
- 4.2.2 Shift From Post-Process Detection to Real-Time Defect Prevention
- 4.2.3 Expansion of Serial Production in Metal Additive Manufacturing
- 4.2.4 Integration of Artificial Intelligence With Layer-Wise Imaging Data
- 4.2.5 Cross-Platform Retrofit Demand From Mixed Additive Manufacturing Fleets
- 4.2.6 Rising Demand for Closed-Loop Process Control and Digital Quality Records
- 4.3 Market Restraints
- 4.3.1 High Cost of Integrated Imaging and Edge-Computing Infrastructure
- 4.3.2 Limited Standardization of Image-to-Defect Correlation Across Machines
- 4.3.3 Proprietary Data Silos Restricting Cross-Machine Model Training
- 4.3.4 High Data Volumes and Incomplete Certification Acceptance of In-Situ Evidence
- 4.4 Industry Value Chain Analysis
- 4.5 Impact of Macroeconomic Factors on the Market
- 4.6 Regulatory Landscape
- 4.7 Technological Outlook
- 4.8 Porter's Five Forces Analysis
- 4.8.1 Bargaining Power of Suppliers
- 4.8.2 Bargaining Power of Buyers
- 4.8.3 Threat of New Entrants
- 4.8.4 Threat of Substitutes
- 4.8.5 Intensity of Competitive Rivalry
5 MARKET SIZE AND GROWTH FORECASTS (VALUE)
- 5.1 By Imaging Technology
- 5.1.1 Visible-Light Imaging
- 5.1.2 Thermal and Infrared Imaging
- 5.1.3 Optical Tomography and Coherence Imaging
- 5.1.4 X-Ray and Other Advanced Imaging
- 5.2 By Additive Manufacturing Process
- 5.2.1 Powder Bed Fusion
- 5.2.2 Directed Energy Deposition
- 5.2.3 Binder Jetting
- 5.2.4 Material Extrusion
- 5.2.5 Vat Photopolymerization
- 5.2.6 Other Additive Manufacturing Processes
- 5.3 By Offering
- 5.3.1 Imaging and Sensor Hardware
- 5.3.2 Data Acquisition and Edge-Computing Hardware
- 5.3.3 Monitoring Software and Analytics
- 5.3.4 Integration, Calibration, Validation, and Support Services
- 5.4 By End-User
- 5.4.1 Aerospace and Defense
- 5.4.2 Medical Devices and Implants
- 5.4.3 Energy and Power Generation
- 5.4.4 Industrial Machinery and Heavy Engineering
- 5.4.5 Automotive and Transportation
- 5.4.6 Research Institutions and Universities
- 5.4.7 Other End-Users
- 5.5 By Geography
- 5.5.1 North America
- 5.5.1.1 United States
- 5.5.1.2 Canada
- 5.5.1.3 Mexico
- 5.5.2 South America
- 5.5.2.1 Brazil
- 5.5.2.2 Argentina
- 5.5.2.3 Rest of South America
- 5.5.3 Europe
- 5.5.3.1 Germany
- 5.5.3.2 United Kingdom
- 5.5.3.3 France
- 5.5.3.4 Italy
- 5.5.3.5 Spain
- 5.5.3.6 Rest of Europe
- 5.5.4 Asia-Pacific
- 5.5.4.1 China
- 5.5.4.2 Japan
- 5.5.4.3 India
- 5.5.4.4 South Korea
- 5.5.4.5 ASEAN
- 5.5.4.6 Rest of Asia-Pacific
- 5.5.5 Middle East
- 5.5.5.1 Saudi Arabia
- 5.5.5.2 United Arab Emirates
- 5.5.5.3 Turkey
- 5.5.5.4 Rest of the Middle East
- 5.5.6 Africa
- 5.5.6.1 South Africa
- 5.5.6.2 Nigeria
- 5.5.6.3 Rest of Africa
- 5.5.1 North America
6 COMPETITIVE LANDSCAPE
- 6.1 Market Concentration
- 6.2 Strategic Moves
- 6.3 Market Share Analysis
- 6.4 Company Profiles (includes Global Level Overview, Market Level Overview, Core Segments, Financials as available, Strategic Information, Market Rank/Share, Products and Services, Recent Developments)
- 6.4.1 EOS GmbH
- 6.4.2 Renishaw plc
- 6.4.3 Nikon SLM Solutions AG
- 6.4.4 Additive Industries B.V.
- 6.4.5 Velo3D, Inc.
- 6.4.6 3D Systems Corporation
- 6.4.7 Stratasys Ltd.
- 6.4.8 TRUMPF SE + Co. KG
- 6.4.9 SLM Solutions Group AG
- 6.4.10 Farsoon Technologies Co., Ltd.
- 6.4.11 Aconity3D GmbH
- 6.4.12 Freemelt AB
- 6.4.13 Meltio S.L.
- 6.4.14 Lithoz GmbH
- 6.4.15 Formlabs, Inc.
- 6.4.16 BigRep GmbH
- 6.4.17 Markforged Holding Corporation
- 6.4.18 Xact Metal, Inc.
- 6.4.19 Additive Industries North America Inc.
- 6.4.20 Desktop Metal, Inc.
- 6.4.21 Additive Assurance Pty Ltd
- 6.4.22 Phase3D, Inc.
- 6.4.23 Addiguru, Inc.
- 6.4.24 Interspectral AB
- 6.4.25 Euler 3D, Inc.
- 6.4.26 NexusAM Ltd
7 MARKET OPPORTUNITIES AND FUTURE OUTLOOK
- 7.1 White-Space and Unmet-Need Assessment

