PUBLISHER: Mordor Intelligence | PRODUCT CODE: 2187409

PUBLISHER: Mordor Intelligence | PRODUCT CODE: 2187409
Used and Refurbished Smartphone - Market Share Analysis, Industry Trends & Statistics, Growth Forecasts (2027 - 2032)
According to Mordor Intelligence, the used and refurbished smartphone market size was valued at USD 69.66 billion in 2026 and estimated to grow from USD 74.42 billion in 2027 to reach USD 101.1 billion by 2032, at a CAGR of 6.32% during the forecast period (2027-2032).
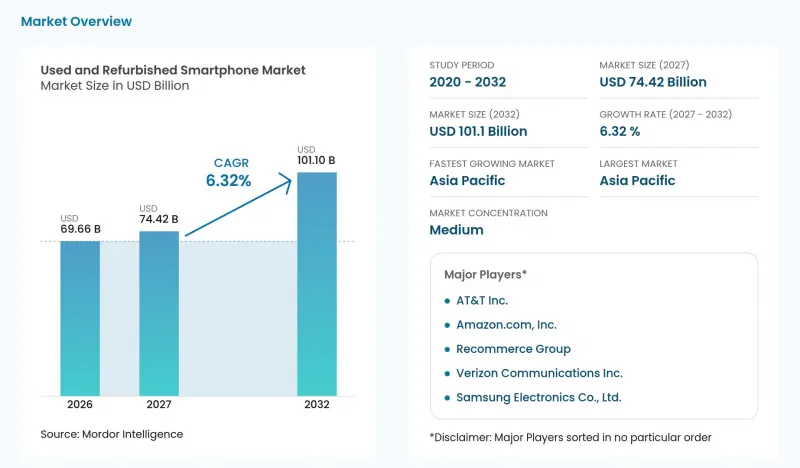
This report is segmented by Device Condition (Used and more), Sales Channel (Online Marketplaces and more), Price Band (USD 200-399 and more), End User (Consumer/Individual and more), and Geography (Asia Pacific and more). The market forecasts are provided in terms of value (USD), based on availability.
Global Used and Refurbished Smartphone Market Trends and Insights
Rising smartphone retail prices driving secondary-market demand
Higher replacement prices increase the potential saving from obtaining useful smartphone functionality through a previously owned device. Samsung's U.S. launch starting price for the new Galaxy S26+ in 2026 was USD 100 higher than for the Galaxy S25+ in 2025. Separately, Vodafone Institute's 2025 survey in Germany, France, Spain, Sweden and the United Kingdom identified price and functionality as leading refurbished-phone purchase considerations. Affordability therefore depends on the performance a buyer retains as well as the purchase price. A larger acquisition-price gap can leave room for restoration expenditure while preserving a saving against a new replacement. That gives refurbishers a commercial reason to improve usable condition within the price advantage that attracts the buyer.
Expansion of online marketplaces enabling convenient transactions
Online resale is easier to assess when the buyer can inspect the particular handset being offered. Cashify's app in India lets buyers view a video of the exact refurbished mobile phone under consideration, showing its natural visible condition. Once a device sells, Cashify promptly removes its video from the system. Device-specific images can reduce uncertainty about appearance before payment, making remote assessment more useful than a generic condition label. That can reduce a reason to require an in-store inspection before considering an online purchase. Online refurbished sellers can therefore compete for buyers who want to inspect visible condition before paying, widening the potential audience for remote transactions.
Consumer concerns around quality and warranties
Quality concerns constrain refurbished demand even when a seller offers a formal warranty. In March 2025, 49% of surveyed consumers aged 16 to 64 in Germany, France, Sweden, Spain and the United Kingdom cited refurbished-phone performance or functionality as a purchase barrier. Within the same survey, 44% cited concern that the warranty would not be honored. These are different commercial hurdles because acceptable device performance does not itself establish confidence in the seller's remedy. A warranty can therefore leave purchase hesitation unresolved when the buyer doubts its practical enforceability. Sellers face the additional task of making both functional condition and access to a remedy credible before a lower price can secure the sale.
Other drivers and restraints analyzed in the detailed report include:
- OEM-led trade-in and certified refurbishment programs
- Sustainability regulations and consumer eco-consciousness
- Proliferation of counterfeit parts and gray-market sellers
For complete list of drivers and restraints, kindly check the Table Of Contents.
Segment Analysis
Used smartphones accounted for a 60.66% share of the used and refurbished smartphone market size in 2026. An already functional handset can retain resale utility without a restoration step that would add cost to the transaction. The buyer's relevant comparison is the price of obtaining the required functions over the device's remaining useful life. That favors condition-specific pricing, because cosmetic wear and loss of usable function carry different consequences for a second owner. An as-is seller can price residual utility directly, preserving a route for usable handsets whose restoration would not earn back its cost.
Refurbished/certified pre-owned smartphones are the fastest-growing segment, projected to expand at a 6.82% CAGR during 2027-2032. Recommerce Group's analysis of its own 2025 European sales volumes reported rapid entry of the iPhone 14 range into its refurbished-smartphone ranking and the first volumes of the iPhone 15. That mix gives refurbishment specialists a route to restoring recent hardware whose remaining capabilities can support another sale. Recommerce Group's 2026 European barometer found that 60% of potential buyers favored refurbishment specialists for refurbished phones. Specialists therefore have a reason to combine access to recent models with a restoration promise that makes their role recognizable at purchase.
Online marketplaces represented a 38.51% used and refurbished smartphone market share in 2026. Back Market's refurbished-electronics marketplace recorded more than USD 3.5 billion in global gross merchandise value in 2025, up 32% year over year. It connects consumers with sellers of refurbished electronics. This structure makes seller participation relevant to channel scale, because transactions can be distributed across multiple suppliers through one customer-facing platform. For refurbishers, access to that transaction pool can separate distribution reach from ownership of the platform, creating a route to buyers beyond their own storefront.
OEM certified refurbished stores are the fastest-growing segment, forecast to grow at an 8.4% CAGR during 2027-2032. In January 2026, Samsung expanded its Galaxy S25-series certified refurbished program to Germany and the United Kingdom as Certified Re-Newed, and to France as Refurbished Premium by Samsung. It reported in-house inspection and more than 100 quality tests, with new-device warranty terms that may vary by country. The Galaxy S25, S25+ and S25 Ultra refurbished models were available exclusively through Samsung.com in select markets. The manufacturer's direct channel therefore combines a wider operating footprint with control over the restoration promise, giving buyers a defined party behind both the handset and the sale.
Complete Report Scope:
- By Device Condition
- Used
- Refurbished/Certified Pre-Owned
- By Sales Channel
- Online Marketplaces
- Offline Retailers
- Carrier/Operator Trade-In Programs
- OEM Certified Refurbished Stores
- Wholesale/B2B
- By Price Band
- < USD 100
- USD 100-199
- USD 200-399
- USD 400-599
- >= USD 600
- By End User
- Consumer/Individual
- Business/Enterprise
- Government/Institutional
- By Geography
- North America
- United States
- Canada
- Mexico
- South America
- Brazil
- Argentina
- Rest of South America
- Europe
- Germany
- United Kingdom
- France
- Italy
- Spain
- Russia
- Rest of Europe
- Asia Pacific
- China
- India
- Japan
- South Korea
- Southeast Asia
- Rest of Asia Pacific
- Middle East
- Saudi Arabia
- United Arab Emirates
- Turkey
- Rest of Middle East
- Africa
- South Africa
- Nigeria
- Egypt
- Rest of Africa
- North America
Geography Analysis
Asia Pacific accounted for a 41.69% share of the used and refurbished smartphone market size in 2026 and is the fastest-growing geography, with a projected 8% CAGR during 2027-2032. In China, ATRenew recorded 41.8 million consumer-product transactions in 2025, distributing products to merchants and consumers through its operated marketplaces and other channels. The count includes repeat transactions of the same product before returns and cancellations and excludes products collected for recycling. That activity at a single Chinese operator demonstrates a substantial resale distribution base within Asia Pacific. Linking merchant redistribution with consumer-facing transactions can support further handset resale through an established platform rather than requiring each refurbisher to build separate downstream outlets.
North America's consumer trade-in route includes U.S. mobile programs that returned more than USD 6.4 billion to consumers in 2025, up 42% from 2024. Those payments link device returns to a consumer's recovery of residual value, providing an intake mechanism that can feed later resale. In South America, Brazil's Trocafy, Allied Distribuidora's refurbished-smartphone platform, expanded into retail and relationships with Magalu, Mercado Livre and Shopee in 2025. For Trocafy, these Brazilian relationships can spread customer access across retail and several marketplaces, reducing dependence on any single distribution route.
Formal seller results in Portugal and Turkey distinguish Europe's and the Middle East's channel opportunities from Africa's formal-resale infrastructure gap. Swappie Oy reported that Portugal had its highest average order value among its markets in 2025, up 6% from the year-earlier period. In Turkey, MediaMarkt Turkiye reported on April 10, 2026 that its refurbished-phone sales over the previous 2 months doubled year over year, using its 2025 fiscal-year sales average. In its November 2025 assessment, GSMA identified limited formal resale channels and refurbishment infrastructure in Africa as factors that may deter risk-averse buyers. Combining refurbishment capacity with a formal sales outlet could help an African entrant reach risk-averse buyers whom informal channels may leave unserved.
- Apple Inc.
- Samsung Electronics Co., Ltd.
- Back Market, Inc.
- Amazon.com, Inc.
- Recommerce Group
- Verizon Communications Inc.
- AT&T Inc.
- Best Buy Co., Inc.
- Alibaba Group Holding Ltd.
- Swappie Oy
- Cashify (Manak Waste Management Private Limited)
- Gazelle (ecoATM, LLC)
- Likewize Corp. (Brightstar Corp.)
- Trocafone S.A.
- musicMagpie Limited (Decluttr)
- FoneGiant Limited
- Reboxed Ltd.
Additional Benefits:
- The market estimate (ME) sheet in Excel format
- 3 months of analyst support
TABLE OF CONTENTS
1 INTRODUCTION
- 1.1 Study Assumptions and Market Definition
- 1.2 Scope of the Study
2 RESEARCH METHODOLOGY
3 EXECUTIVE SUMMARY
4 MARKET LANDSCAPE
- 4.1 Market Overview
- 4.2 Market Drivers
- 4.2.1 Rising smartphone retail prices driving secondary-market demand
- 4.2.2 Expansion of online marketplaces enabling convenient transactions
- 4.2.3 OEM-led trade-in and certified refurbishment programs
- 4.2.4 Sustainability regulations and consumer eco-consciousness
- 4.2.5 5G-driven device replacement cycles increasing used-phone supply
- 4.2.6 Enterprise device-leasing models feeding high-grade inventory
- 4.3 Market Restraints
- 4.3.1 Consumer concerns around quality and warranties
- 4.3.2 Proliferation of counterfeit parts and gray-market sellers
- 4.3.3 Software security locks limiting refurb viability
- 4.3.4 Tightening e-waste import/export regulations
- 4.4 Industry Value Chain Analysis
- 4.5 Regulatory Landscape
- 4.6 Technological Outlook
- 4.7 Porter's Five Forces Analysis
- 4.7.1 Threat of New Entrants
- 4.7.2 Bargaining Power of Suppliers
- 4.7.3 Bargaining Power of Buyers
- 4.7.4 Threat of Substitutes
- 4.7.5 Competitive Rivalry
- 4.8 Distribution Channel Landscape (OEMs vs Third-Party Platforms)
- 4.9 Impact of 5G on Used and Refurbished Smartphones
- 4.10 Impact of Macroeconomic Factors on the Market
5 MARKET SIZE AND GROWTH FORECASTS (VALUE)
- 5.1 By Device Condition
- 5.1.1 Used
- 5.1.2 Refurbished/Certified Pre-Owned
- 5.2 By Sales Channel
- 5.2.1 Online Marketplaces
- 5.2.2 Offline Retailers
- 5.2.3 Carrier/Operator Trade-In Programs
- 5.2.4 OEM Certified Refurbished Stores
- 5.2.5 Wholesale/B2B
- 5.3 By Price Band
- 5.3.1 < USD 100
- 5.3.2 USD 100-199
- 5.3.3 USD 200-399
- 5.3.4 USD 400-599
- 5.3.5 >= USD 600
- 5.4 By End User
- 5.4.1 Consumer/Individual
- 5.4.2 Business/Enterprise
- 5.4.3 Government/Institutional
- 5.5 By Geography
- 5.5.1 North America
- 5.5.1.1 United States
- 5.5.1.2 Canada
- 5.5.1.3 Mexico
- 5.5.2 South America
- 5.5.2.1 Brazil
- 5.5.2.2 Argentina
- 5.5.2.3 Rest of South America
- 5.5.3 Europe
- 5.5.3.1 Germany
- 5.5.3.2 United Kingdom
- 5.5.3.3 France
- 5.5.3.4 Italy
- 5.5.3.5 Spain
- 5.5.3.6 Russia
- 5.5.3.7 Rest of Europe
- 5.5.4 Asia Pacific
- 5.5.4.1 China
- 5.5.4.2 India
- 5.5.4.3 Japan
- 5.5.4.4 South Korea
- 5.5.4.5 Southeast Asia
- 5.5.4.6 Rest of Asia Pacific
- 5.5.5 Middle East
- 5.5.5.1 Saudi Arabia
- 5.5.5.2 United Arab Emirates
- 5.5.5.3 Turkey
- 5.5.5.4 Rest of Middle East
- 5.5.6 Africa
- 5.5.6.1 South Africa
- 5.5.6.2 Nigeria
- 5.5.6.3 Egypt
- 5.5.6.4 Rest of Africa
- 5.5.1 North America
6 COMPETITIVE LANDSCAPE
- 6.1 Market Concentration
- 6.2 Strategic Moves
- 6.3 Market Share Analysis
- 6.4 Company Profiles (includes Global level Overview, Market level overview, Core Segments, Financials as available, Strategic Information, Market Rank/Share for key companies, Products and Services, and Recent Developments)
- 6.4.1 Apple Inc.
- 6.4.2 Samsung Electronics Co., Ltd.
- 6.4.3 Back Market, Inc.
- 6.4.4 Amazon.com, Inc.
- 6.4.5 Recommerce Group
- 6.4.6 Verizon Communications Inc.
- 6.4.7 AT&T Inc.
- 6.4.8 Best Buy Co., Inc.
- 6.4.9 Alibaba Group Holding Ltd.
- 6.4.10 Swappie Oy
- 6.4.11 Cashify (Manak Waste Management Private Limited)
- 6.4.12 Gazelle (ecoATM, LLC)
- 6.4.13 Likewize Corp. (Brightstar Corp.)
- 6.4.14 Trocafone S.A.
- 6.4.15 musicMagpie Limited (Decluttr)
- 6.4.16 FoneGiant Limited
- 6.4.17 Reboxed Ltd.
7 MARKET OPPORTUNITIES AND FUTURE OUTLOOK
- 7.1 White-Space and Unmet-Need Assessment

