PUBLISHER: Mordor Intelligence | PRODUCT CODE: 2187738

PUBLISHER: Mordor Intelligence | PRODUCT CODE: 2187738
Digital Marketing - Market Share Analysis, Industry Trends & Statistics, Growth Forecasts (2027 - 2032)
According to Mordor Intelligence, the digital marketing market size is estimated at USD 0.76 trillion in 2026 and is projected to be USD 0.84 trillion in 2027, reaching USD 1.38 trillion by 2032, growing at a CAGR of 10.47% from 2027 to 2032.
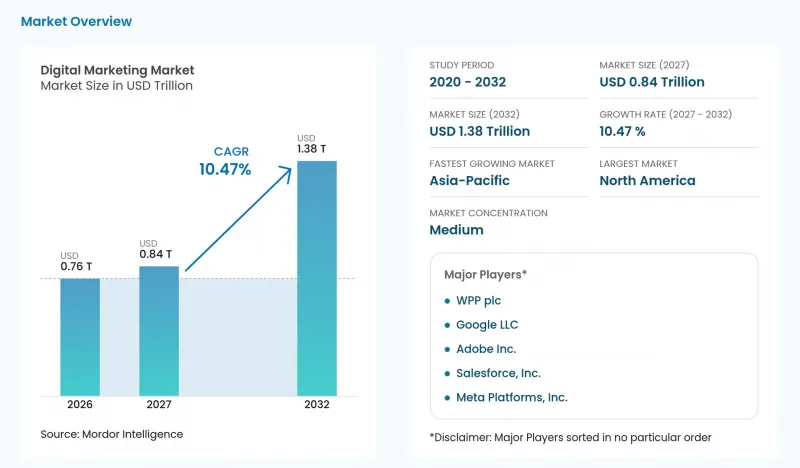
This report is segmented by Digital Channel (Online Advertising, Search and Display, Social Media Marketing, and more), Enterprise Size (Large Enterprises and Small and Medium Enterprises), End-User Industry (Retail and E-Commerce, IT and Telecommunications, and more), and Geography (North America, Asia-Pacific, and more). The market forecasts are provided in terms of value (USD), based on availability.
Global Digital Marketing Market Trends and Insights
Rising First-Party Data Adoption Across Walled Gardens
Growing use of advertiser-owned information creates a commercial role for data preparation and activation alongside paid media. In the Advertising Research Foundation (ARF) 2025 Metrics Survey, 62% of agencies and 48% of advertisers reported increasing their use of first-party data. For an agency working with those inputs, the task is to connect advertiser-specific information with a defined audience or measurement decision. The higher agency response indicates that this change also affects campaign intermediaries, rather than only the advertisers holding the data.
Rapid Shift To AI-Assisted Campaign Planning And Optimization
AI adoption creates a broader implementation opportunity when it reaches media decisions as well as creative work. The World Federation of Advertisers' (WFA) 2026 study covered 54 senior respondents from 46 major brand owners and found that 96% used generative or agentic AI, compared with 45% in 2023. Within that sample, 54% used AI for media buying and optimization, while 48% used it for marketing strategy and planning. Roughly half of the surveyed brand owners did not report AI use in each of these budget-related activities. Support that connects an AI recommendation to a planning or buying decision would address a specific adoption gap within these large-brand operations.
Signal Loss From Third-Party Cookie Restrictions And Mobile Privacy Controls
Permission-dependent identifiers narrow the evidence available to app advertisers comparing acquisition channels. Apple requires App Tracking Transparency permission for cross-company advertising tracking on iOS 14.5, iPadOS 14.5, and tvOS 14.5 or later. Without permission, covered tracking is prohibited and the advertising identifier is all zeros. In IAB Europe's August to September 2025 survey of over 79 advertisers, agencies, publishers, and ad tech providers across 27+ European markets, 53% identified attribution without cookies as a measurement challenge. Both constraints raise the work needed to connect exposure with response, limiting how uniformly advertisers can evaluate channels. The remaining verification burden makes app-campaign expansion harder to justify from observed conversions alone.
Other drivers and restraints analyzed in the detailed report include:
- Expansion Of Commerce-Led Social And Creator Marketing
- Growth Of Privacy-Resilient Measurement And Incrementality Testing
- Martech Stack Fragmentation And Integration Debt
For complete list of drivers and restraints, kindly check the Table Of Contents.
Segment Analysis
Online advertising, search and display accounted for a 33.15% share of the digital marketing market size in 2026, making it the largest segment. United States search advertising generated USD 114.2 billion in 2025, according to IAB and PwC. The same report put United States display advertising revenue at USD 81.6 billion, up 9.8% year over year in 2025. Alphabet's Google Search & other properties, including Gmail, Google Maps, and Google Play, recorded 13% more paid clicks and 3% higher average charges per click in Q2 2026 than in Q2 2025. For Google's click-driven business, the larger volume increase than price increase makes engagement delivery central to scale, while higher unit charges increase the importance of returns.
Influencer marketing is the fastest-growing segment, with a projected CAGR of 14.75% from 2027 to 2032. CreatorIQ's 2026 global survey reported average annual creator marketing investment of USD 4.8 million among surveyed organizations, up 33% year over year. The July to August study surveyed 2,000 brand and agency respondents across 9 countries and reported USD 8.8 million in enterprise investment. Within that survey, the enterprise reading identifies a higher-budget client tier with more room for services around creator coordination and campaign management.
Complete Report Scope:
- By Digital Channel
- Search Engine Optimization (SEO)
- Social Media Marketing
- Online Advertising, Search and Display
- Content Marketing
- Email Marketing
- Influencer Marketing
- Marketing Automation
- Digital Customer Engagement Solutions
- Analytics and Reporting Tools
- Other Digital Channels
- By Enterprise Size
- Large Enterprises
- Small and Medium Enterprises
- By End-User Industry
- Retail and E-Commerce
- IT and Telecommunications
- BFSI
- Healthcare and Life Sciences
- Media and Entertainment
- Travel and Hospitality
- Manufacturing and Industrials
- Other End-User Industries
- By Geography
- North America
- United States
- Canada
- Mexico
- South America
- Brazil
- Argentina
- Chile
- Rest of South America
- Europe
- Germany
- United Kingdom
- France
- Italy
- Spain
- Rest of Europe
- Asia-Pacific
- China
- Japan
- India
- South Korea
- Australia
- Rest of Asia-Pacific
- Middle East
- Saudi Arabia
- United Arab Emirates
- Qatar
- Rest of Middle East
- Africa
- South Africa
- Egypt
- Nigeria
- Rest of Africa
- North America
Geography Analysis
North America accounted for 35.81% of the digital marketing market size in 2026, making it the largest geography. IAB and PwC reported United States internet advertising revenue of USD 294.6 billion in 2025, up 13.9% year over year. In Canada, the 2025 advertising topline grew 16% year over year across the survey's established digital advertising categories. For regional providers, Canada's independently expanding advertising base supports a national execution offer alongside United States campaigns.
Asia-Pacific is the fastest-growing geography, with a projected CAGR of 15.7% from 2027 to 2032. IAB SEA+India reported in October 2025 that retail media was moving from a specialist channel to a core part of the marketing and commerce mix in Southeast Asia and India. IAB Australia reported 14% year-over-year growth in Australia's unaudited internet advertising revenue series in FY26, measured as gross commissionable charges before agency rebates. These readings connect the region's campaign-service opportunity to commerce-linked media as well as a growing Australian advertising revenue base. Because the Australian measure counts gross advertising charges, execution and measurement fees need to be distinguished from media amounts passed through to platforms.
In Europe, retail media investment grew 16.7% in 2025, first exceeding 10% of digital advertising spending, while Poland's online-video advertising expanded year over year in Q1 2026. In South America, commerce accounted for 25% of Brazil's 2025 digital-advertising investment, while Colombia's influencer-ad investment grew that year. In the Middle East, Meta's tools showed Qatar's Instagram potential ad reach rising 200,000, or 13.3%, from October 2024 to October 2025, while Kuwait's Decree-Law No. 102 of 2026, published October 4 and due to take effect six months after publication, will require licenses for paid and unpaid social-media promoters targeting local audiences, subject to executive regulations. In Africa, 121 South African industry professionals surveyed in 2025 valued branded content mainly for visibility rather than engagement, while Facebook led Kenya's FY2025/26 digital-advertising channels. Retail media in Europe and commerce advertisers in Brazil show commerce-linked buying, South African respondents prioritized visibility, and Kuwait's future licenses will add compliance work.
- Google LLC
- Meta Platforms, Inc.
- Adobe Inc.
- Salesforce, Inc.
- WPP plc
- Publicis Groupe S.A.
- Interpublic Group of Companies, Inc.
- Dentsu Group Inc.
- Accenture plc
- HubSpot, Inc.
- SAP SE
- Microsoft Corporation
- Oracle Corporation
- IBM Corporation
- Hootsuite Inc.
- Sprinklr, Inc.
- Braze, Inc.
- Criteo S.A.
- Klaviyo, Inc.
- The Trade Desk, Inc.
Additional Benefits:
- The market estimate (ME) sheet in Excel format
- 3 months of analyst support
TABLE OF CONTENTS
1 INTRODUCTION
- 1.1 Study Assumptions and Market Definition
- 1.2 Scope of the Study
2 RESEARCH METHODOLOGY
3 EXECUTIVE SUMMARY
4 MARKET LANDSCAPE
- 4.1 Market Overview
- 4.2 Market Drivers
- 4.2.1 Rising First-Party Data Adoption Across Walled Gardens
- 4.2.2 Rapid Shift To AI-Assisted Campaign Planning And Optimization
- 4.2.3 Expansion Of Commerce-Led Social And Creator Marketing
- 4.2.4 Growth Of Privacy-Resilient Measurement And Incrementality Testing
- 4.2.5 Increasing Demand For Vertical-Specific MarTech Workflows
- 4.2.6 Convergence Of Marketing Automation With CRM And Customer Data Platforms
- 4.3 Market Restraints
- 4.3.1 Signal Loss From Third-Party Cookie Restrictions And Mobile Privacy Controls
- 4.3.2 Martech Stack Fragmentation And Integration Debt
- 4.3.3 Rising Content, Talent, And Paid Media Costs
- 4.3.4 Measurement Complexity Across Cross-Device And Multi-Touch Journeys
- 4.4 Industry Value Chain Analysis
- 4.5 Regulatory Landscape
- 4.6 Technological Outlook
- 4.7 Porter's Five Forces Analysis
- 4.7.1 Threat of New Entrants
- 4.7.2 Bargaining Power of Suppliers
- 4.7.3 Bargaining Power of Buyers
- 4.7.4 Threat of Substitutes
- 4.7.5 Competitive Rivalry
- 4.8 Impact of Macroeconomic Factors on the Market
5 MARKET SIZE AND GROWTH FORECASTS (VALUE)
- 5.1 By Digital Channel
- 5.1.1 Search Engine Optimization (SEO)
- 5.1.2 Social Media Marketing
- 5.1.3 Online Advertising, Search and Display
- 5.1.4 Content Marketing
- 5.1.5 Email Marketing
- 5.1.6 Influencer Marketing
- 5.1.7 Marketing Automation
- 5.1.8 Digital Customer Engagement Solutions
- 5.1.9 Analytics and Reporting Tools
- 5.1.10 Other Digital Channels
- 5.2 By Enterprise Size
- 5.2.1 Large Enterprises
- 5.2.2 Small and Medium Enterprises
- 5.3 By End-User Industry
- 5.3.1 Retail and E-Commerce
- 5.3.2 IT and Telecommunications
- 5.3.3 BFSI
- 5.3.4 Healthcare and Life Sciences
- 5.3.5 Media and Entertainment
- 5.3.6 Travel and Hospitality
- 5.3.7 Manufacturing and Industrials
- 5.3.8 Other End-User Industries
- 5.4 By Geography
- 5.4.1 North America
- 5.4.1.1 United States
- 5.4.1.2 Canada
- 5.4.1.3 Mexico
- 5.4.2 South America
- 5.4.2.1 Brazil
- 5.4.2.2 Argentina
- 5.4.2.3 Chile
- 5.4.2.4 Rest of South America
- 5.4.3 Europe
- 5.4.3.1 Germany
- 5.4.3.2 United Kingdom
- 5.4.3.3 France
- 5.4.3.4 Italy
- 5.4.3.5 Spain
- 5.4.3.6 Rest of Europe
- 5.4.4 Asia-Pacific
- 5.4.4.1 China
- 5.4.4.2 Japan
- 5.4.4.3 India
- 5.4.4.4 South Korea
- 5.4.4.5 Australia
- 5.4.4.6 Rest of Asia-Pacific
- 5.4.5 Middle East
- 5.4.5.1 Saudi Arabia
- 5.4.5.2 United Arab Emirates
- 5.4.5.3 Qatar
- 5.4.5.4 Rest of Middle East
- 5.4.6 Africa
- 5.4.6.1 South Africa
- 5.4.6.2 Egypt
- 5.4.6.3 Nigeria
- 5.4.6.4 Rest of Africa
- 5.4.1 North America
6 COMPETITIVE LANDSCAPE
- 6.1 Market Concentration
- 6.2 Strategic Moves
- 6.3 Market Share Analysis
- 6.4 Company Profiles (includes Global level Overview, Market level overview, Core Segments, Financials as available, Strategic Information, Market Rank/Share for key companies, Products and Services, and Recent Developments)
- 6.4.1 Google LLC
- 6.4.2 Meta Platforms, Inc.
- 6.4.3 Adobe Inc.
- 6.4.4 Salesforce, Inc.
- 6.4.5 WPP plc
- 6.4.6 Publicis Groupe S.A.
- 6.4.7 Interpublic Group of Companies, Inc.
- 6.4.8 Dentsu Group Inc.
- 6.4.9 Accenture plc
- 6.4.10 HubSpot, Inc.
- 6.4.11 SAP SE
- 6.4.12 Microsoft Corporation
- 6.4.13 Oracle Corporation
- 6.4.14 IBM Corporation
- 6.4.15 Hootsuite Inc.
- 6.4.16 Sprinklr, Inc.
- 6.4.17 Braze, Inc.
- 6.4.18 Criteo S.A.
- 6.4.19 Klaviyo, Inc.
- 6.4.20 The Trade Desk, Inc.
7 MARKET OPPORTUNITIES AND FUTURE OUTLOOK
- 7.1 White-Space and Unmet-Need Assessment

