
PUBLISHER: Mordor Intelligence | PRODUCT CODE: 1911709

PUBLISHER: Mordor Intelligence | PRODUCT CODE: 1911709
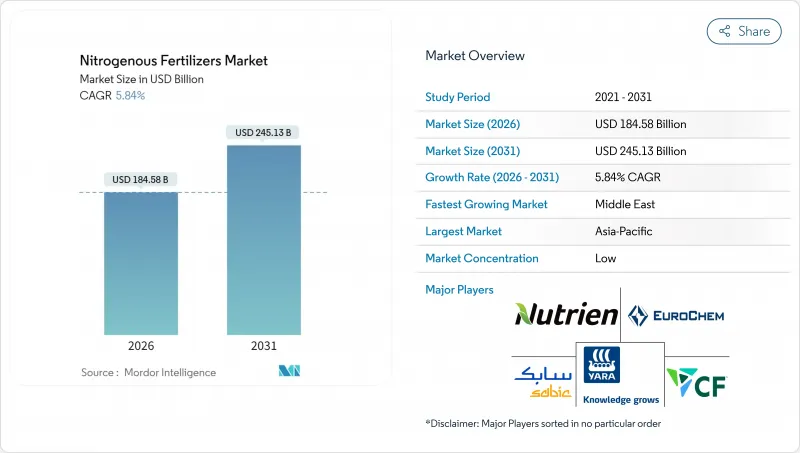
Nitrogenous Fertilizers - Market Share Analysis, Industry Trends & Statistics, Growth Forecasts (2026 - 2031)
Nitrogenous fertilizers market size in 2026 is estimated at USD 184.58 billion, growing from 2025 value of USD 174.4 billion with 2031 projections showing USD 245.13 billion, growing at 5.84% CAGR over 2026-2031.
This growth is attributed to rising global food demand, advancements in farming practices, and innovations in nutrient management. Government support through subsidies and policy measures remains a critical factor. For instance, the European Commission has suspended tariffs on urea and ammonia until the end of 2024 to ensure the availability, affordability, and sustainability of fertilizers amid supply chain disruptions. Regionally, Asia-Pacific dominates the market due to its extensive agricultural activity, robust government support, and increasing adoption of precision farming technologies. The competitive landscape comprises both global and regional players, while global companies are focusing on capacity expansion, feedstock diversification, and the adoption of low-carbon technologies. Meanwhile, regional producers and specialty suppliers are gaining market share through localized distribution, customized product offerings, and collaborations with agricultural technology platforms. The nitrogenous fertilizers market is evolving into a technology-driven and regionally adaptive industry, offering significant opportunities for innovation and strategic growth across the value chain.
Global Nitrogenous Fertilizers Market Trends and Insights
Rising Demand for Staple Crops
Global population growth is intensifying the demand for food, placing mounting pressure on agricultural systems to deliver higher yields from limited land. As the world's population is projected to reach 9.7 billion by 2050, food production must increase by approximately 70% to meet the growing nutritional needs of this population. This surge in demand is reshaping farming practices, encouraging greater use of nitrogenous fertilizers to boost crop output and stabilize yields amid climate variability. Rising incomes, particularly in developing regions, are shifting dietary preferences toward protein-rich grains, prompting the intensified cultivation of crops like wheat and rice, which require higher nitrogen fertilizer application rates. Climate variability further underscores the need for consistent yields, encouraging the strategic use of fertilizers to stabilize output. In many regions, multiple-cropping systems, which involve rotating maize, soybeans, and rice within a single year, are increasing fertilizer use per hectare. This trend reflects a focus on maximizing productivity on existing farmland rather than expanding acreage.
Sustained Government Support for Agricultural Inputs
Governments worldwide recognize the importance of affordable plant nutrients for rural stability and food security. Many have expanded support programs, including direct input grants, freight rebates, and low-interest loans, to ensure reliable access to fertilizers for farmers. India has increased its fertilizer subsidy budget to INR 1.75 trillion (approximately USD 21 billion) for the fiscal year 2024-25, ensuring continued access for farmers despite fiscal constraints. Brazil's Plano Safra 2024-25 earmarked BRL 400 billion (USD 75 billion) in credit to support fertilizer procurement. These initiatives signal strong demand to the private sector, encouraging investment in production capacity, distribution infrastructure, and innovation. Some governments are promoting domestic ammonia production to reduce their dependency on imports and strengthen their supply chains. This policy shift aims to build long-term resilience in them to fertilizer availability beyond price controls.
Tightening Environmental Regulations
Environmental policies aimed at reducing nutrient runoff and greenhouse gas emissions are reshaping global fertilizer usage. Governments are implementing stricter regulations on application timing, dosage, and product formulations to protect ecosystems and water sources. In regions like the United States, nitrate caps and sustainability benchmarks are becoming increasingly common, prompting farmers to adopt precision methods and more efficient fertilizers. These changes are driving innovation in product development and application technologies, aligning fertilizer use with environmental goals. As regulations tighten, the nitrogenous fertilizers market will increasingly reflect the adoption of advanced products that deliver agronomic performance with reduced environmental impact. This transition represents a significant shift for the industry, striking a balance between productivity and environmental stewardship.
Other drivers and restraints analyzed in the detailed report include:
- Diversification of Ammonia Supply Sources
- Optimization of Urea Production Capacity
- Emergence of Biological Nitrogen-Fixation Alternatives
For complete list of drivers and restraints, kindly check the Table Of Contents.
Segment Analysis
Urea accounted for 43.12% of the nitrogenous fertilizers market share in 2025, with the segment projected to post a 6.78% CAGR to 2031 as growers value its 46% nitrogen concentration and flexible application. Urea's cost advantage and compatibility with both soil incorporation and fertigation underpin its position across large-scale grain systems. Producers are upgrading plants with energy-saving catalysts and emission control units, reinforcing supply security at competitive costs. Continuous investment, such as CF Industries' Donaldsonville expansion, enhances regional self-sufficiency and export capability, sustaining urea's leadership in the nitrogen fertilizer market.
Specialty grades are gaining traction in irrigated horticulture and high-value cash crops, where precise nutrient delivery translates into revenue gains. Ammonium nitrate remains relevant in geographies with established regulations and storage infrastructure, while anhydrous ammonia serves direct injection systems in North American row crops. As environmental scrutiny rises, demand for low-volatility or coated products is set to escalate, adding diversity without displacing urea's central role.
Conventional fertilizers retained a 92.12% share of the nitrogenous fertilizers market size in 2025, expanding at a 5.86% CAGR during the forecast period, broadly in line with overall demand, as global acreage growth and price sensitivity favor bulk granular products. Large centralized plants benefit from economies of scale, which keep unit costs low and ensure competitiveness in developing markets. Widespread dealer networks and farmer familiarity also reinforce the dominance of conventional forms in broad-acre cropping sectors.
Specialty fertilizers represent a smaller segment, led by controlled-release and slow-release technologies that enhance nutrient-use efficiency and minimize environmental losses. Liquid solutions used in fertigation and hydroponic systems broaden application flexibility in water-constrained regions. Water-soluble grades cater to greenhouse operations seeking precise nutrient regimes. Though premium-priced, specialty forms achieve strong adoption where returns justify higher upfront costs, particularly in protected cropping and intensive fruit and vegetable production, promising incremental gains for the nitrogen fertilizer market.
The Nitrogen Fertilizers Market Report is Segmented by Product (Ammonium Nitrate, Anhydrous Ammonia, and Others), Form (Conventional, Specialty), Application Mode (Fertigation, Foliar, and Soil), Crop Type (Field Crops, Horticultural Crops, and Others), and Geography (Asia-Pacific, Europe, Middle East, Africa, North America, and South America). The Market Forecasts are Provided in Terms of Value (USD) and Volume (Metric Tons).
Geography Analysis
The Asia-Pacific region captured 35.42% of the revenue in 2025 of the nitrogenous fertilizers market size, reflecting its vast agricultural land, high cropping intensity, and supportive subsidy frameworks. China's emphasis on food security and India's modernization of smallholder farming guarantee robust baseline demand. Rising adoption of multiple-cropping systems and higher-yielding hybrids requires sustained nitrogen input, and domestic production capacity limits import exposure for many regional players. Emerging Southeast Asian economies are experiencing incremental growth as they intensify palm, rice, and vegetable cultivation to meet the needs of expanding urban centers.
The Middle East delivers the fastest growth at 6.94% CAGR through 2031, leveraging abundant gas feedstock and proximity to shipping lanes that connect Asia and Africa. Large-scale investments in blue and green ammonia plants by ADNOC, SABIC, and Fertiglobe aim to supply both domestic agricultural projects and export markets. Government policies favor agricultural diversification to reduce import dependence, boosting internal consumption of nitrogen fertilizers. Integration of carbon capture solutions in new plants positions the region as a low-emission supplier, strengthening its competitive edge.
North America and Europe maintain mature yet evolving markets. North American producers benefit from shale gas economics that support export competitiveness, while adoption of precision agriculture sustains incremental volume growth. Europe's stringent environmental policy constrains tonnage but spurs demand for enhanced-efficiency products and digital advisory services that align with Farm to Fork objectives. South America grows on the back of Brazilian frontier expansion and Argentine yield recovery, whereas Africa represents long-run potential as infrastructure, credit access, and extension services improve fertilizer penetration.
- Nutrien Ltd.
- Yara International ASA
- CF Industries Holdings, Inc.
- SABIC Agri-Nutrients Company (Saudi Basic Industries Corporation)
- Koch Fertilizer, LLC (Koch Industries, Inc.)
- EuroChem Group AG
- OCI N.V.
- Coromandel International Limited (Murugappa Group)
- Indian Farmers Fertiliser Co-operative Limited
- Grupa Azoty S.A.
- Petronas Chemicals Group Berhad (Petroliam Nasional Berhad)
- Abu Qir Fertilizers and Chemical Industries Company
- PT Pupuk Indonesia (Persero)
Additional Benefits:
- The market estimate (ME) sheet in Excel format
- 3 months of analyst support
TABLE OF CONTENTS
1 INTRODUCTION
- 1.1 Study Assumptions and Market Definition
- 1.2 Scope of the Study
- 1.3 Research Methodology
2 REPORT OFFERS
3 EXECUTIVE SUMMARY AND KEY FINDINGS
4 KEY INDUSTRY TRENDS
- 4.1 Acreage of Major Crop Types
- 4.1.1 Field Crops
- 4.1.2 Horticultural Crops
- 4.2 Average Nutrient Application Rates
- 4.2.1 Primary Nutrients
- 4.2.1.1 Field Crops
- 4.2.1.2 Horticultural Crops
- 4.2.1 Primary Nutrients
- 4.3 Agricultural Land Equipped For Irrigation
- 4.4 Regulatory Framework
- 4.5 Value Chain & Distribution Channel Analysis
- 4.6 Market Drivers
- 4.6.1 Rising Demand for Staple Crops
- 4.6.2 Sustained Government Support for Agricultural Inputs
- 4.6.3 Diversification of Ammonia Supply Sources
- 4.6.4 Optimization of Urea Production Capacity
- 4.6.5 Acceleration of Green Ammonia Pilot Projects
- 4.6.6 Adoption of Digital Advisory Platforms for Nitrogen Use
- 4.7 Market Restraints
- 4.7.1 Volatility in Natural Gas Prices
- 4.7.2 Tightening Environmental Regulations
- 4.7.3 Logistical Bottlenecks in Fertilizer Trade
- 4.7.4 Emergence of Biological Nitrogen-Fixation Alternatives
5 MARKET SIZE AND GROWTH FORECASTS (VALUE AND VOLUME)
- 5.1 Product
- 5.1.1 Ammonium Nitrate
- 5.1.2 Anhydrous Ammonia
- 5.1.3 Urea
- 5.1.4 Others
- 5.2 Form
- 5.2.1 Conventional
- 5.2.2 Speciality
- 5.2.2.1 CRF
- 5.2.2.2 Liquid Fertilizer
- 5.2.2.3 SRF
- 5.2.2.4 Water Soluble
- 5.3 Application Mode
- 5.3.1 Fertigation
- 5.3.2 Foliar
- 5.3.3 Soil
- 5.4 Crop Type
- 5.4.1 Field Crops
- 5.4.2 Horticultural Crops
- 5.4.3 Turf & Ornamental
- 5.5 Region
- 5.5.1 Asia-Pacific
- 5.5.1.1 Australia
- 5.5.1.2 Bangladesh
- 5.5.1.3 China
- 5.5.1.4 India
- 5.5.1.5 Indonesia
- 5.5.1.6 Japan
- 5.5.1.7 Pakistan
- 5.5.1.8 Philippines
- 5.5.1.9 Thailand
- 5.5.1.10 Vietnam
- 5.5.1.11 Rest of Asia-Pacific
- 5.5.2 Europe
- 5.5.2.1 France
- 5.5.2.2 Germany
- 5.5.2.3 Italy
- 5.5.2.4 Netherlands
- 5.5.2.5 Russia
- 5.5.2.6 Spain
- 5.5.2.7 Ukraine
- 5.5.2.8 United Kingdom
- 5.5.2.9 Rest of Europe
- 5.5.3 Middle East
- 5.5.3.1 Turkey
- 5.5.3.2 Saudi Arabia
- 5.5.3.3 Rest of Middle East
- 5.5.4 Africa
- 5.5.4.1 South Africa
- 5.5.4.2 Nigeria
- 5.5.4.3 Rest of Africa
- 5.5.5 North America
- 5.5.5.1 Canada
- 5.5.5.2 Mexico
- 5.5.5.3 United States
- 5.5.5.4 Rest of North America
- 5.5.6 South America
- 5.5.6.1 Argentina
- 5.5.6.2 Brazil
- 5.5.6.3 Rest of South America
- 5.5.1 Asia-Pacific
6 COMPETITIVE LANDSCAPE
- 6.1 Key Strategic Moves
- 6.2 Market Share Analysis
- 6.3 Company Landscape
- 6.4 Company Profiles (Includes Global Level Overview, Market Level Overview, Core Segments, Financials as Available, Strategic Information, Market Rank/Share for Key Companies, Products and Services, and Recent Developments)
- 6.4.1 Nutrien Ltd.
- 6.4.2 Yara International ASA
- 6.4.3 CF Industries Holdings, Inc.
- 6.4.4 SABIC Agri-Nutrients Company (Saudi Basic Industries Corporation)
- 6.4.5 Koch Fertilizer, LLC (Koch Industries, Inc.)
- 6.4.6 EuroChem Group AG
- 6.4.7 OCI N.V.
- 6.4.8 Coromandel International Limited (Murugappa Group)
- 6.4.9 Indian Farmers Fertiliser Co-operative Limited
- 6.4.10 Grupa Azoty S.A.
- 6.4.11 Petronas Chemicals Group Berhad (Petroliam Nasional Berhad)
- 6.4.12 Abu Qir Fertilizers and Chemical Industries Company
- 6.4.13 PT Pupuk Indonesia (Persero)
7 KEY STRATEGIC QUESTIONS FOR FERTILIZER CEOS

