
PUBLISHER: Mordor Intelligence | PRODUCT CODE: 1937280

PUBLISHER: Mordor Intelligence | PRODUCT CODE: 1937280
United States Commercial Real Estate - Market Share Analysis, Industry Trends & Statistics, Growth Forecasts (2026 - 2031)
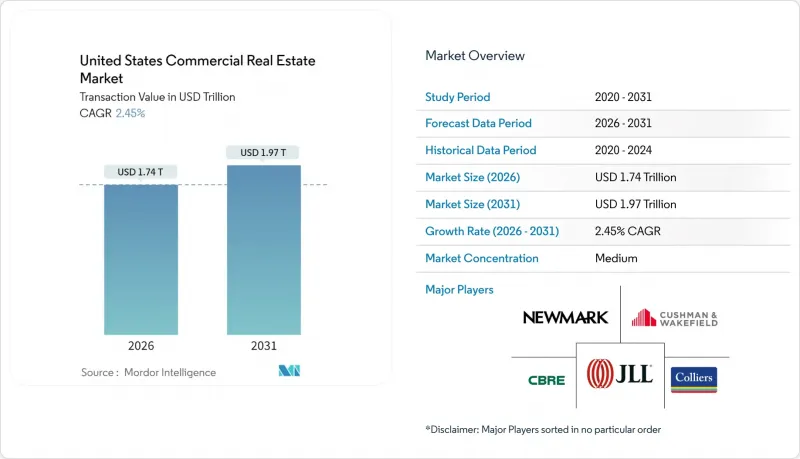
The United States Commercial Real Estate Market size in 2026 is estimated at USD 1.74 trillion, growing from 2025 value of USD 1.7 trillion with 2031 projections showing USD 1.97 trillion, growing at 2.45% CAGR over 2026-2031.
Stabilizing interest-rate expectations are restoring underwriting confidence, while abundant public-market liquidity enables real estate investment trusts (REITs) to resume debt issuance at favorable spreads. Capital is rotating toward logistics and data-center assets, although elevated office vacancies in Tier 1 cities continue to suppress rent growth. Insurance-premium inflation linked to climate risk is widening return differentials between coastal and inland assets, encouraging portfolio diversification. Forward-looking developers emphasize adaptive-reuse projects and AI-enabled building systems that lower operating costs and attract technology-sensitive tenants.
United States Commercial Real Estate Market Trends and Insights
Normalization of Interest-Rate Expectations
Federal Reserve signaling has ended the volatility that constrained deal flow, and transaction volumes are projected to rebound to USD 322 billion in 2024 and USD 387 billion in 2025. Cap-rate expansion is slowing as financing costs stabilize, enabling value-add sponsors to model renovation budgets with greater certainty. Gateway-city Class A properties are again priced on forward cash-flow metrics instead of distress discounts, although secondary markets still command premium risk spreads. Lenders' willingness to fix terms for five-to-seven-year paper supports bridge-loan takeouts and mezzanine recapitalizations. The shift from crisis-mode capital preservation toward strategic deployment underpins moderate yet durable growth in the US commercial real estate market.
Resurgent REIT Capital Inflows
Nareit data indicate a record USD 42.5 billion in potential debt issuance for 2025 as REITs exploit lower spreads relative to private credit. Blackstone's USD 10 billion AIR Communities acquisition and a USD 7 billion data-center joint venture illustrate renewed appetite for scale transactions. Public-market access lets REITs arbitrage liquidity by acquiring distressed assets that privately sponsored funds cannot quickly finance. Healthcare and data-center verticals receive disproportionate flows because secular demand for senior living and cloud infrastructure decouples them from GDP cycles. The liquidity advantage is accelerating consolidation, further professionalizing asset management across the US commercial real estate market.
Sticky Remote-/Hybrid-Work Office Vacancy
Office vacancy is projected to hit 24% by 2026, erasing USD 8-10 billion in annual rental income and endangering up to USD 250 billion of asset value. Long-dated leases signed pre-pandemic are expiring, and tenants are rightsizing footprints to hybrid usage models that require fewer individual workstations. Central business districts reliant on commuter inflows face slow demand recovery and mounting civic-fiscal stress. Adaptive-reuse policies promise relief but entail large capital budgets and zoning approvals that prolong payback periods. Persistent structural vacancy will continue to weigh on growth prospects for the US commercial real estate market until hybrid norms stabilize.
Other drivers and restraints analyzed in the detailed report include:
- Accelerating E-commerce & 3PL Demand for Logistics Space
- AI-Optimized Workplace Re-configurations
- Elevated Debt-Service Costs & Tighter Bank Underwriting
For complete list of drivers and restraints, kindly check the Table Of Contents.
Segment Analysis
Logistics assets contributed a 3.92% CAGR to the US commercial real estate market between 2026 and 2031, whereas offices maintained the largest 28.32% share in 2025 despite continued demand headwinds. The logistics boom stems from e-commerce growth, supply-chain redundancy mandates, and tax incentives that favor near-shoring, producing sustained pre-leasing momentum even as capital costs rise. Highland prices near intermodal nodes restrict speculative development, allowing landlords to lock in above-trend rent escalations. By contrast, the US commercial real estate market size associated with offices is contracting in absolute square footage as occupancy rationalization offsets modest rent increases at trophy buildings. Tenant preferences are splitting the office universe into tech-ready Class A towers and commodity Class B assets destined for redevelopment, compressing yield expectations across investor classes.
Second-order effects reinforce logistics leadership. Prologis reported cash same-store NOI growth of 4.9% in Q2 2025 and a 53.4% mark-to-market upon rollover, confirming durable pricing leverage. Investors redeploy capital from underperforming office funds toward industrial platforms that bundle development, cold-chain, and automation capabilities. Developers weighing office-to-logistics conversions must navigate structural column spacing, dock-door requirements, and community pushback on truck traffic factors that complicate but do not preclude asset repurposing. Retail centers are stabilizing through experiential offerings and last-mile pick-up hubs, yet vacancy persists among legacy enclosed malls. Hospitality properties rebound on travel recovery, but RevPAR gains vary sharply by metro, underscoring the nuanced allocation required within the wider US commercial real estate market.
The US Commercial Real Estate Market Report is Segmented by Property Type (Offices, Retail, Logistics, Others), by Business Model (Sales, Rental), by End-User (Individuals/Households, Corporates & SMEs, Others), and by Geography (Texas, California, Florida, New York, Illinois, Rest of US). The Market Forecasts are Provided in Terms of Value (USD).
List of Companies Covered in this Report:
- CBRE
- JLL
- Cushman & Wakefield
- Newmark
- Colliers
- Marcus & Millichap
- SVN International
- Transwestern
- Brookfield Properties
- Prologis
- Simon Property Group
- RE/MAX Commercial
- Century 21 Commercial
- Keller Williams Commercial
- Coldwell Banker Commercial
- Franklin Street
- Mohr Partners
- Crexi
- HqO
- VTS
Additional Benefits:
- The market estimate (ME) sheet in Excel format
- 3 months of analyst support
TABLE OF CONTENTS
1 Introduction
- 1.1 Study Assumptions & Market Definition
- 1.2 Scope of the Study
2 Research Methodology
3 Executive Summary
4 Market Landscape
- 4.1 Market Overview
- 4.2 Commercial Real Estate Buying Trends - Socio-economic & Demographic Insights
- 4.3 Rental Yield Analysis
- 4.4 Capital-Market Penetration & REIT Presence
- 4.5 Regulatory Outlook
- 4.6 Technological Outlook
- 4.7 Insights into Existing and Upcoming Projects
- 4.8 Market Drivers
- 4.8.1 Normalisation of interest-rate expectations
- 4.8.2 Resurgent REIT capital inflows
- 4.8.3 Accelerating e-commerce & 3PL demand for logistics space
- 4.8.4 AI-optimised workplace re-configurations
- 4.8.5 Secondary-market liquidity for LP stakes in private real-estate funds
- 4.9 Market Restraints
- 4.9.1 Sticky remote-/hybrid-work-driven office vacancy
- 4.9.2 Elevated debt-service costs & tighter bank underwriting
- 4.9.3 Climate-risk-linked insurance-premium shock
- 4.9.4 Zoning lag on office-to-mixed-use conversions
- 4.10 Value / Supply-Chain Analysis
- 4.10.1 Overview
- 4.10.2 Real Estate Developers and Contractors - Key Quantitative and Qualitative Insights
- 4.10.3 Real Estate Brokers and Agents - Key Quantitative and Qualitative Insights
- 4.10.4 Property Management Companies - Key Quantitative and Qualitative Insights
- 4.10.5 Insights on Valuation Advisory and Other Real Estate Services
- 4.10.6 State of the Building Materials Industry and Partnerships with Key Developers
- 4.10.7 Insights on Key Strategic Real Estate Investors/Buyers in the Market
- 4.11 Industry Attractiveness - Porter's Five Force Analysis
- 4.11.1 Threat of New Entrants
- 4.11.2 Bargaining Power of Buyers/Occupiers
- 4.11.3 Bargaining Power of Suppliers (Developers/Builders)
- 4.11.4 Threat of Substitutes
- 4.11.5 Competitive Rivalry Intensity
5 Market Size & Growth Forecasts (Value, In USD Billion)
- 5.1 By Property Type
- 5.1.1 Offices
- 5.1.2 Retail
- 5.1.3 Logistics
- 5.1.4 Others (industrial real estate, hospitality real estate, etc.)
- 5.2 By Business Model
- 5.2.1 Sales
- 5.2.2 Rental
- 5.3 By End-user
- 5.3.1 Individuals / Households
- 5.3.2 Corporates & SMEs
- 5.3.3 Others
- 5.4 By Geography
- 5.4.1 Texas
- 5.4.2 California
- 5.4.3 Florida
- 5.4.4 New York
- 5.4.5 Illinois
- 5.4.6 Rest of US
6 Competitive Landscape
- 6.1 Market Concentration
- 6.2 Strategic Moves
- 6.3 Market Share Analysis
- 6.4 Company Profiles {(includes Global level Overview, Market level overview, Core Segments, Financials as available, Strategic Information, Products & Services, and Recent Developments)}
- 6.4.1 CBRE
- 6.4.2 JLL
- 6.4.3 Cushman & Wakefield
- 6.4.4 Newmark
- 6.4.5 Colliers
- 6.4.6 Marcus & Millichap
- 6.4.7 SVN International
- 6.4.8 Transwestern
- 6.4.9 Brookfield Properties
- 6.4.10 Prologis
- 6.4.11 Simon Property Group
- 6.4.12 RE/MAX Commercial
- 6.4.13 Century 21 Commercial
- 6.4.14 Keller Williams Commercial
- 6.4.15 Coldwell Banker Commercial
- 6.4.16 Franklin Street
- 6.4.17 Mohr Partners
- 6.4.18 Crexi
- 6.4.19 HqO
- 6.4.20 VTS
7 Market Opportunities & Future Outlook

