
PUBLISHER: Mordor Intelligence | PRODUCT CODE: 1690080

PUBLISHER: Mordor Intelligence | PRODUCT CODE: 1690080
United States Data Center - Market Share Analysis, Industry Trends & Statistics, Growth Forecasts (2025 - 2030)
The United States Data Center Market size is estimated at 20.39 thousand MW in 2025, and is expected to reach 26.12 thousand MW by 2030, growing at a CAGR of 5.08%. Further, the market is expected to generate colocation revenue of USD 24,036.4 Million in 2025 and is projected to reach USD 38,675.3 Million by 2030, growing at a CAGR of 9.98% during the forecast period (2025-2030).
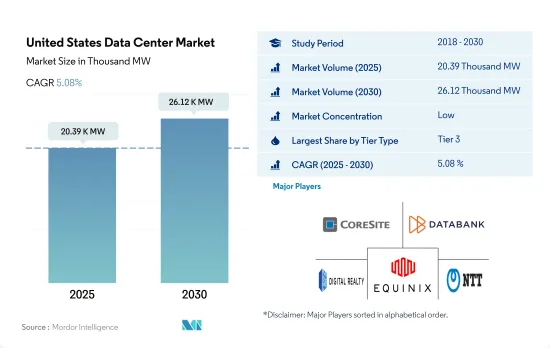
Tier 3 data center accounted for majority share in terms of volume in 2023
- Tier 3 data centers are the most preferred in the country. They operated at an IT load capacity of 5,319.6 MW in 2022. Tier 3 data centers have redundant and dual-powered servers, storage, network links, and other IT components. As of 2022, the country had 399 tier 3 data centers. Around 73 data centers are under construction with Tier 3 standards.
- SMEs generally prefer a Tier 3-rated facility. SMEs are a vital component of the US economy, as they comprise 99.9% of active enterprises. End users such as BFSI and telecom are focusing on hyperscale colocation services.
- Tier 4 data centers are the next most preferred, mainly by large enterprises, as they provide 99.995% uptime. However, high cost is the major factor for the low adoption of these facilities. With the data traffic generation, upcoming data centers are expected to follow Tier 4 standards. In the United States, IP traffic reached an annual run rate of 955.7 exabytes in 2021, up from an annual run rate of 376.2 exabytes in 2016, suggesting the growing demand for more redundant and efficient facilities. As a result, tier 4 data centers are expected to hold the highest market share of 48.9% in 2029, followed by tier 3 facilities with a share of 45.4%.
- Tier 1 & 2 data centers are the least preferred as tier 1 has an expected uptime of 99.671% (28.8 hours of downtime annually), while tier 2 has an expected uptime of 99.741% (22 hours of downtime annually). These data centers are commonly utilized by small businesses looking for a cost-effective option for their data storage needs. However, due to lower functionality, even SMEs are focusing on adopting wholesale colocation services with a Tier 3 certification. Therefore, tier 1 & 2 DCs are expected to showcase the lowest growth.
United States Data Center Market Trends
Increase use of video calling, augmented in-store shopping experiences, remote health services, and improved mobile gaming to drive market growth
- With the introduction of faster network alternatives, such as 5G and extensive fiber connectivity supporting technologies like FWA, data consumption through smartphones increased from 1.8 GB in 2018 to about 8.5 GB in 2022 at a CAGR of 24.7%. This consumption is expected to further increase to more than 64 GB by 2029, at a CAGR of 33.6%. As 5G drives smartphone adoption and upgrades, the market will witness more data generating points, leading to increased data consumption that leverages higher wireless network speeds.
- Faster internet and the subsequent penetration of devices capable of accessing it play a crucial role in determining and estimating data consumption in a region. Data suggests that the number of 5G mobile connections in the United States will increase from 15% in 2021 to about 68% by 2025, signifying high 5G mobile penetration in the country. Users find enhanced video calling, augmented in-store shopping experiences, remote health services, and improved mobile gaming as some of the activities through 5G networks to be very or extremely appealing, which contributes to data usage.
- Several apps account for considerable smartphone reach across audiences, with YouTube accounting for about 74% audience reach, followed by 61% for Gmail, 59% for Facebook, and 58% for the Google Search app. The extensive reach of such smartphone apps, despite the Android and iOS division among the audience, signifies deep app penetration and usage in the United States. This highlights the need for data storage to provide the required memory platforms for such media to perform and store user data, thereby creating a greater demand for data processing facilities.
Smartphone adoption and increasing 5G connections to drive market growth
- The United States is a significant market in both North America and the global smartphone portfolio. With smartphone adoption expected to grow from 83% in 2021 to 85% by 2025, it will substantially contribute to the growth of subscriber penetration rates, increasing from 85% in 2021 to 86% by 2025. This growth will result in a rise in smartphone sales and the overall number of smartphones in the country. Although longer replacement rates and a lack of compelling features in the US smartphone industry led to a decrease in sales in 2018, the market received a major boost with the 5G rollout and adoption by operators in the highly competitive smartphone market.
- Additionally, data released in January 2022 indicated a USD 1.7 billion increase in smartphone sales value, totaling approximately USD 74.7 billion in 2022, compared to about USD 73 billion in 2021. Despite the market slowdown during COVID-19, 5G has been a key driver of smartphone adoption and penetration in the United States. The pandemic increased the anticipated number of 5G connections in 2025 from 205 million to about 218 million, signifying how 5G would drive better smartphone sales in the region.
- The increase in the number of smartphones was observed through the growth of mobile wireless subscriber connections in the country, rising from about 442.5 million in 2019 to approximately 498.91 million by 2021. This trend indicates the high penetration rates contributing to sales. Over the forecast period, 5G will heavily contribute to data generation through increased data points, generating demand for more data centers to store and process the data.
United States Data Center Industry Overview
The United States Data Center Market is fragmented, with the top five companies occupying 16.24%. The major players in this market are CoreSite (America Tower Corporation), Databank Holdings Ltd, Digital Realty Trust, Inc., Equinix, Inc. and NTT Ltd. (sorted alphabetically).
Additional Benefits:
- The market estimate (ME) sheet in Excel format
- 3 months of analyst support
TABLE OF CONTENTS
1 EXECUTIVE SUMMARY & KEY FINDINGS
2 REPORT OFFERS
3 INTRODUCTION
- 3.1 Study Assumptions & Market Definition
- 3.2 Scope of the Study
- 3.3 Research Methodology
4 MARKET OUTLOOK
- 4.1 It Load Capacity
- 4.2 Raised Floor Space
- 4.3 Colocation Revenue
- 4.4 Installed Racks
- 4.5 Rack Space Utilization
- 4.6 Submarine Cable
5 Key Industry Trends
- 5.1 Smartphone Users
- 5.2 Data Traffic Per Smartphone
- 5.3 Mobile Data Speed
- 5.4 Broadband Data Speed
- 5.5 Fiber Connectivity Network
- 5.6 Regulatory Framework
- 5.6.1 United States
- 5.7 Value Chain & Distribution Channel Analysis
6 MARKET SEGMENTATION (INCLUDES MARKET SIZE IN VOLUME, FORECASTS UP TO 2030 AND ANALYSIS OF GROWTH PROSPECTS)
- 6.1 Hotspot
- 6.1.1 Atlanta
- 6.1.2 Austin
- 6.1.3 Boston
- 6.1.4 Chicago
- 6.1.5 Dallas
- 6.1.6 Houston
- 6.1.7 Los Angeles
- 6.1.8 New Jersey
- 6.1.9 New York
- 6.1.10 Northern California
- 6.1.11 Northern Virginia
- 6.1.12 Northwest
- 6.1.13 Phoenix
- 6.1.14 Salt Lake City
- 6.1.15 Rest of United States
- 6.2 Data Center Size
- 6.2.1 Large
- 6.2.2 Massive
- 6.2.3 Medium
- 6.2.4 Mega
- 6.2.5 Small
- 6.3 Tier Type
- 6.3.1 Tier 1 and 2
- 6.3.2 Tier 3
- 6.3.3 Tier 4
- 6.4 Absorption
- 6.4.1 Non-Utilized
- 6.4.2 Utilized
- 6.4.2.1 By Colocation Type
- 6.4.2.1.1 Hyperscale
- 6.4.2.1.2 Retail
- 6.4.2.1.3 Wholesale
- 6.4.2.2 By End User
- 6.4.2.2.1 BFSI
- 6.4.2.2.2 Cloud
- 6.4.2.2.3 E-Commerce
- 6.4.2.2.4 Government
- 6.4.2.2.5 Manufacturing
- 6.4.2.2.6 Media & Entertainment
- 6.4.2.2.7 Telecom
- 6.4.2.2.8 Other End User
7 COMPETITIVE LANDSCAPE
- 7.1 Market Share Analysis
- 7.2 Company Landscape
- 7.3 Company Profiles (includes Global Level Overview, Market Level Overview, Core Business Segments, Financials, Headcount, Key Information, Market Rank, Market Share, Products and Services, and Analysis of Recent Developments).
- 7.3.1 CoreSite (America Tower Corporation)
- 7.3.2 CyrusOne Inc.
- 7.3.3 Cyxtera Technologies
- 7.3.4 Databank Holdings Ltd
- 7.3.5 Digital Realty Trust, Inc.
- 7.3.6 Equinix, Inc.
- 7.3.7 Flexential Corp.
- 7.3.8 H5 Data Centers LLC
- 7.3.9 NTT Ltd.
- 7.3.10 Quality Technology Services
- 7.3.11 Switch
- 7.3.12 Vantage Data Centers, LLC
- 7.4 LIST OF COMPANIES STUDIED
8 KEY STRATEGIC QUESTIONS FOR DATA CENTER CEOS
9 APPENDIX
- 9.1 Global Overview
- 9.1.1 Overview
- 9.1.2 Porter's Five Forces Framework
- 9.1.3 Global Value Chain Analysis
- 9.1.4 Global Market Size and DROs
- 9.2 Sources & References
- 9.3 List of Tables & Figures
- 9.4 Primary Insights
- 9.5 Data Pack
- 9.6 Glossary of Terms

